Comparative Study
. 2009 Apr 15;29(15):5000-8.
doi: 10.1523/JNEUROSCI.5807-08.2009.

Kainate receptors act as conditional amplifiers of spike transmission at hippocampal mossy fiber synapses

Affiliations
Comparative Study

Kainate receptors act as conditional amplifiers of spike transmission at hippocampal mossy fiber synapses

Shankar Sachidhanandam et al. J Neurosci. .

Abstract

Hippocampal mossy fiber (Mf) synapses are viewed as conditional detonators, assisting CA3 cells in complex network functions. By analyzing mice deficient for GluK2 (GluR6), GluK3 (GluR7) and GluK5 (KA2) genes we show that kainate receptors (KARs) play a crucial role in the control of synaptic integration and spike transmission efficacy at Mf synapses. We dissected out the role of the different KAR functions at Mf synapses and we show that presynaptic and postsynaptic KARs concur to amplify unitary Mf synaptic inputs to trigger spike discharge within a wide range of frequencies (from 1 to 50 Hz). Moreover, KARs strongly favor spike transmission in response to patterns of presynaptic activity mimicking in vivo dentate granule cell activity. By amplifying spike transmission, KARs also facilitate the induction of associative long-term potentiation in CA3. Hence the actions of KARs as amplifiers of spike transmission contribute largely to the "conditional detonator" function of Mf synapses and are likely important for spatial information processing.


Figures
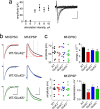
Figure 1.
Figure 1.
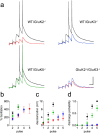
KARs shape unitary Mf-EPSCs and Mf–EPSPs. a, Mf-EPSC amplitude (left) as a function of stimulation intensity reveals the minimal stimulation needed to record from a single Mf synapse. Superimposed recordings (right) during increasing intensity of stimulation showing “all or none” unitary Mf-EPSCs. b, Superimposed averaged unitary Mf-EPSCs (left) and corresponding averaged Mf-EPSPs (right) of 15 traces obtained from WT (black) and GluK2−/− (red), GluK3−/− (blue), and GluK5−/− (green) mice. This color code is kept in all figures. In the top left panel, the timeframe of 28–121 ms after stimulation (vertical dotted gray lines) highlights the range where an ANOVA analysis showed a significant difference in Mf-EPSP waveform between WT and GluK2−/− mice (see Results). Residual Mf-EPSP depolarization at 65 ms after the stimulus (vertical whole line) was used as an indication of EPSP decay kinetics (the horizontal dotted gray line corresponds to the resting membrane potential level). Calibrations: 10 ms and 20 pA for Mf-EPSCs, 50 ms and 1 mV for Mf-EPSPs. c, Summary graph of Mf-EPSC amplitudes (top left), charge transfer (top right, presented as mean ± SEM, here and in all subsequent summary graphs), Mf-EPSP amplitudes (bottom left), and residual depolarization 65 ms after stimulation (bottom right) (WT: n = 9; GluK2−/−: n = 8; GluK3−/−: n = 8; GluK5−/−: n = 9; **p < 0.01 and *p < 0.05, compared with WT). Calibration: 10 ms, 20 pA.
Figure 2.
Figure 2.
KARs facilitate spike transmission in response to short trains of stimulation. a, Representative traces of Mf-EPSPs in response to a short 20 Hz stimulation train for WT, GluK2−/−, GluK3−/−, and GluK5−/− mice. b, Summary graph of facilitation of Mf-EPSPs with respect to the amplitude of the first EPSP. c, Summary graph of residual depolarization of Mf-EPSPs. Residual depolarization was measured as the EPSP amplitude 50 ms after each stimulation. d, Summary graph of discharge probability for each pulse of the 20 Hz train. The measurements for frequency facilitation and residual depolarization were obtained from cells that spiked only from the fourth pulse onwards for WT and GluK5−/−, and values for the fourth and fifth pulse were omitted due to spiking. Consequently, WT and GluK5−/− values for the third pulse are probably slightly underestimated. Discharge probability was calculated using all the cells (WT: n = 6; GluK2−/−: n = 8; GluK3−/−: n = 6; GluK5−/−: n = 8). Calibration: 50 ms, 10 mV. Spikes were truncated in all traces.
Figure 3.
Figure 3.
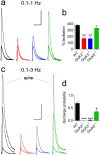
Presynaptic KARs are needed for spike discharge during frequency facilitation. a, Traces illustrating frequency facilitation of Mf-EPSPs when shifting stimulation from 0.1 to 1 Hz for WT, GluK2−/−, GluK3−/−, and GluK5−/− mice. Superimposed traces are averaged from 15 and 40 recordings at 0.1 and 1 Hz, respectively. b, Summary graph of frequency facilitation from 0.1 to 1 Hz (WT: n = 8; GluK2−/−: n = 7; GluK3−/−: n = 6; GluK5−/−: n = 6). c, Traces illustrating frequency facilitation of Mf-EPSPs from 0.1 Hz to 3 Hz, for WT, GluK2−/−, GluK3−/− and GluK5−/− mice. Superimposed traces are averaged from 15 and 40 recordings at 0.1 Hz and 3 Hz respectively, for GluK2−/− and GluK3−/− mice, whereas the 3 Hz traces are averaged before spiking for WT and GluK5−/− mice. Both spikes are individual traces, and are truncated. d, Summary graph of spike discharge probability in response to 60 mossy fiber stimulations at 3 Hz (WT: 0.65 ± 0.07, n = 7; GluK2−/−: 0 ± 0, n = 6; GluK3−/−: 0.01 ± 0.01, n = 5; GluK5−/−: 0.28 ± 0.12, n = 6). The decreased spike discharge probability observed in GluK5−/− compared with WT mice is due both to the increased number of stimuli needed to reach threshold (14 ± 2 vs 7 ± 1) (see also Fig. 4d) and to the decreased spike discharge probability after threshold was reached (0.34 ± 0.13 vs 0.74 ± 0.09). Calibrations: in a, 100 ms and 2 mV; in c, 100 ms and 5 mV. In b and d, *p < 0.05, **p < 0.01, ***p < 0.005 compared with WT.
Figure 4.
Figure 4.
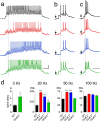
KARs shorten the delay to reach spike discharge. a–c, Representative Mf-EPSP traces in response to 20 Hz (a), 50 Hz (b), and 100 Hz stimulation trains (c) for WT, GluK2−/−, GluK3−/−, and GluK5−/− mice. The arrows point to the first stimulations in the train, which do not trigger sizable Mf-EPSPs. The dotted lines indicate the first spike discharge in corresponding WT traces. d, Summary graphs of the delay to trigger the first spike at 3 Hz (WT: n = 7; GluK5−/−: n = 6), 20 Hz (WT: n = 6; GluK2−/−: n = 8; GluK3−/−: n = 6; GluK5−/−: n = 8), 50 Hz (WT: n = 4; GluK2−/−: n = 6; GluK3−/−: n = 4; GluK5−/−: n = 4), and 100 Hz (WT: n = 5; GluK2−/−: n = 4; GluK3−/−: n = 4; GluK5−/−: n = 4) (*p < 0.05, **p < 0.01, ***p < 0.001 compared with WT). Calibrations: in a, 200 ms and 20 mV; in b, c, 50 ms and 20 mV. Spikes were truncated in all traces.
Figure 5.
Figure 5.
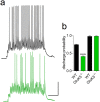
KARs enhances spike discharge probability via GluK5. a, Representative recordings in response to a prolonged 20 Hz stimulation train, with 0.2 mm EGTA in the patch pipette to preserve IsAHP, for WT (top) and GluK5−/− mice (bottom). Note the difference in the number of stimulations needed before spike discharge in GluK5−/− compared with WT mice. b, Summary graph of the spike discharge probability, with and without intact IsAHP, for WT (n = 11 and n = 6, respectively) and GluK5−/− mice (n = 9 and n = 8, respectively). The discharge probability is calculated after the first spike in the train. Representative recordings in the absence of IsAHP are presented in Figure 4a. (***p < 0.005 compared with WT). Calibration: 500 ms, 20 mV. Spikes were truncated in all traces.
Figure 6.
Figure 6.
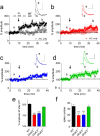
KARs facilitate the induction of A/C LTP. a, A/C LTP was induced by a coincident pairing protocol of stimulation trains to the mossy fibers (5 pulses, 50 Hz) and A/C fibers (8 pulses, 50 Hz), as illustrated. This pairing protocol was repeated 10 times at 1 Hz at the time indicated by the arrow. A/C fibers were otherwise stimulated at 0.1 Hz and EPSP amplitudes were averaged every minute and normalized to the mean amplitude of the 10 min preceding the LTP pairing protocol. Right, Traces represent A/C EPSPs before (a) and after LTP induction (b). A/C only graphs, The gray (a, WT) and the pink (b, GluK2−/−) circles correspond to A/C EPSP amplitudes in conditions where the LTP-inducing train was only delivered to A/C afferents in the absence of a conditioning train to mossy fibers. b–d, As in a, but in GluK2−/−, GluK3−/−, and GluK5−/−mice. e, LTP was significantly diminished 30 min after LTP induction in GluK2−/− and GluK3−/− mice compared with WT mice (WT: 204 ± 6%, n = 16; GluK2−/−: 155 ± 6, n = 15, ***p < 0.001; GluK3−/−: 159 ± 5%, n = 11, ***p < 0.001) and to a small extent in GluK5−/− mice (190 ± 6%, n = 13, p = 0.114). f, A higher number of spikes were evoked during the induction protocol in WT and GluK5−/− mice, compared with GluK2−/− and GluK3−/− mice (WT: 34 ± 3, n = 16; GluK2−/−: 19 ± 4, n = 15, ***p < 0.01; GluK3−/−: 20 ± 4, n = 11, ***p < 0.01; GluK5−/−: 34 ± 3, n = 13, p = 0.858). Calibration: 100 ms and 2 mV for the EPSPs.
Figure 7.
Figure 7.
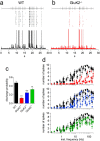
KARs control CA3 pyramidal cell output in response to a physiological granule cell firing pattern of stimulation. a, b, Raster plots of spike discharge from 10 consecutive recordings (top) in response to the physiological pattern illustrated at the top of the panel, with representative recordings (bottom). This pattern of stimulation was extracted from an in vivo recording of a granule cell from the dentate gyrus of a freely moving mouse. Data are from a single CA3 pyramidal cell of a WT (a) and a GluK2−/− mouse (b). c, Probability of spike discharge during physiological pattern of stimulation for WT (n = 16), GluK2−/− (n = 19), GluK3−/− (n = 19), and GluK5−/− (n = 18) mice. Data were pooled from the 30-s-long patterns of stimulation presented here and in supplemental Figure 4, available at www.jneurosci.org as supplemental material. d, Plots of the number of spikes during 10 consecutive recordings as a function of the instantaneous frequency of each stimulation for WT (n = 10) and GluK2−/− (n = 10), GluK3−/− (n = 11), and GluK5−/− (n = 9) mice for the pattern at 2.4 Hz (**p < 0.01, ***p < 0.001 compared to WT).

Similar articles

Cited by

References

    1. Acsády L, Kamondi A, Sík A, Freund T, Buzsáki G. GABAergic cells are the major postsynaptic targets of mossy fibers in the rat hippocampus. J Neurosci. 1998;18:3386–3403. - PMC - PubMed
    1. Bischofberger J, Engel D, Frotscher M, Jonas P. Timing and efficacy of transmitter release at mossy fiber synapses in the hippocampal network. Pflugers Arch. 2006;453:361–372. - PubMed
    1. Castillo PE, Malenka RC, Nicoll RA. Kainate receptors mediate a slow postsynaptic current in hippocampal CA3 neurons. Nature. 1997;388:182–186. - PubMed
    1. Christensen JK, Paternain AV, Selak S, Ahring PK, Lerma J. A mosaic of functional kainate receptors in hippocampal interneurons. J Neurosci. 2004;24:8986–8993. - PMC - PubMed
    1. Contractor A, Swanson G, Heinemann SF. Kainate receptors are involved in short- and long-term plasticity at mossy fiber synapses in the hippocampus. Neuron. 2001;29:209–216. - PubMed

Publication types

MeSH terms

LinkOut - more resources