

Development and validation of a dynamic prognostic tool for prostate cancer recurrence using repeated measures of posttreatment PSA: a joint modeling approach
- PMID: 19369642
- PMCID: PMC2697347
- DOI: 10.1093/biostatistics/kxp009
Development and validation of a dynamic prognostic tool for prostate cancer recurrence using repeated measures of posttreatment PSA: a joint modeling approach
Abstract
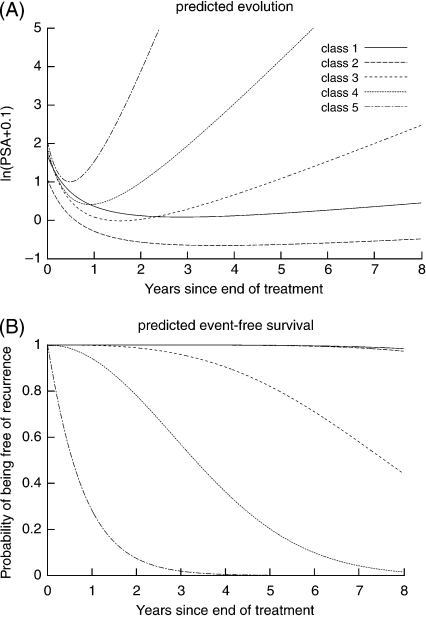
Prostate-specific antigen (PSA) is a biomarker routinely and repeatedly measured on prostate cancer patients treated by radiation therapy (RT). It was shown recently that its whole pattern over time rather than just its current level was strongly associated with prostate cancer recurrence. To more accurately guide clinical decision making, monitoring of PSA after RT would be aided by dynamic powerful prognostic tools that incorporate the complete posttreatment PSA evolution. In this work, we propose a dynamic prognostic tool derived from a joint latent class model and provide a measure of variability obtained from the parameters asymptotic distribution. To validate this prognostic tool, we consider predictive accuracy measures and provide an empirical estimate of their variability. We also show how to use them in the longitudinal context to compare the dynamic prognostic tool we developed with a proportional hazard model including either baseline covariates or baseline covariates and the expected level of PSA at the time of prediction in a landmark model. Using data from 3 large cohorts of patients treated after the diagnosis of prostate cancer, we show that the dynamic prognostic tool based on the joint model reduces the error of prediction and offers a powerful tool for individual prediction.
Figures
References
-
- Altman DG, Royston P. What do we mean by validating a prognostic model? Statistics in Medicine. 2000;19:453–473. - PubMed
-
- D'Amico AV, Moul J, Carroll PR, Sun L, Lubeck D, Chen MH. Prostate specific antigen doubling time as a surrogate end point for prostate cancer specific mortality following radical prostatectomy or radiation therapy. Journal of Urology. 2004;172:S42–S46. - PubMed
-
- Graf E, Schmoor C, Sauerbrei W, Schumacher M. Assessment and comparison of prognostic classification schemes for survival data. Statistics in Medicine. 1999;18:2529–2545. - PubMed
-
- Hawkins DS, Allen DM, Stromberg AJ. Determining the number of components in mixtures of linear models. Computational Statistics and Data Analysis. 2001;38:15–48.
-
- Heagerty PJ, Zheng Y. Survival model predictive accuracy and ROC curves. Biometrics. 2005;61:92–105. - PubMed
Publication types
MeSH terms
Substances
Grants and funding
LinkOut - more resources
Full Text Sources
Medical
Research Materials
Miscellaneous
