

Genomewide association studies of stroke
- PMID: 19369658
- PMCID: PMC2768348
- DOI: 10.1056/NEJMoa0900094
Genomewide association studies of stroke
Abstract
Background: The genes underlying the risk of stroke in the general population remain undetermined.
Methods: We carried out an analysis of genomewide association data generated from four large cohorts composing the Cohorts for Heart and Aging Research in Genomic Epidemiology consortium, including 19,602 white persons (mean [+/-SD] age, 63+/-8 years) in whom 1544 incident strokes (1164 ischemic strokes) developed over an average follow-up of 11 years. We tested the markers most strongly associated with stroke in a replication cohort of 2430 black persons with 215 incident strokes (191 ischemic strokes), another cohort of 574 black persons with 85 incident strokes (68 ischemic strokes), and 652 Dutch persons with ischemic stroke and 3613 unaffected persons.
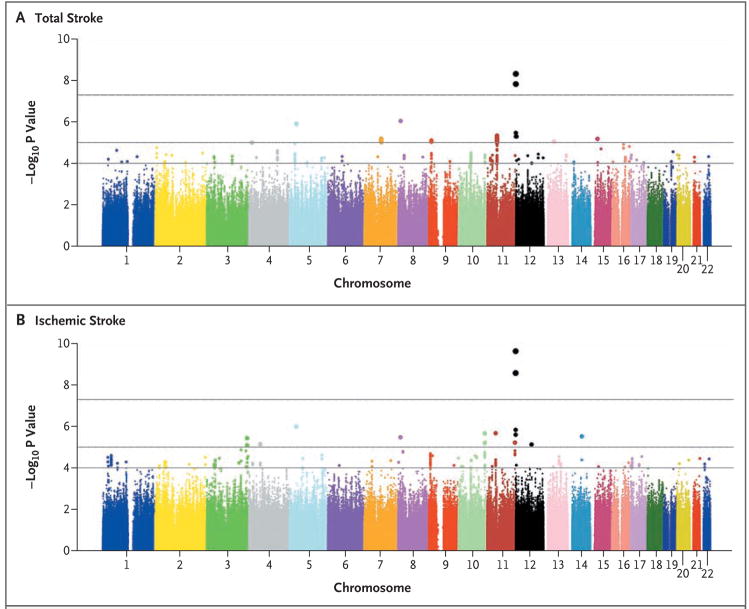
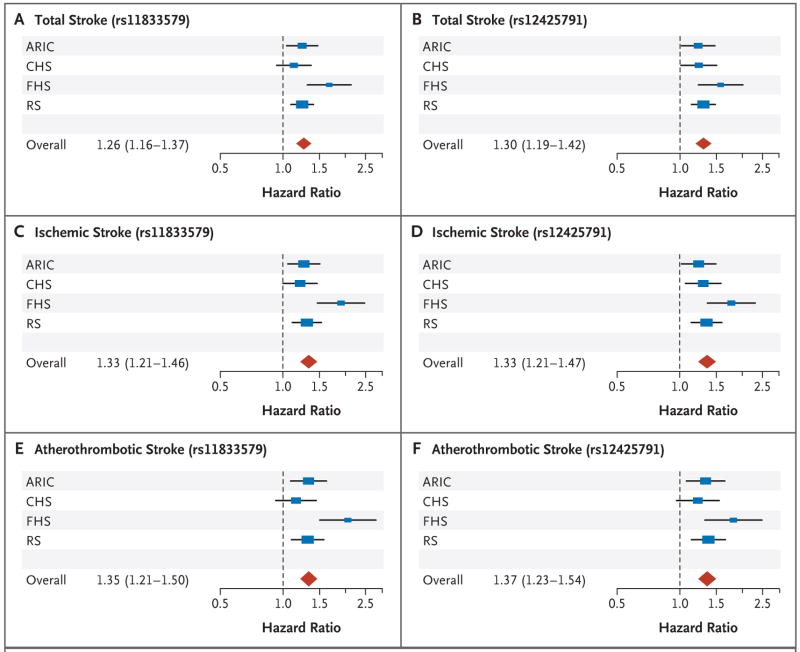
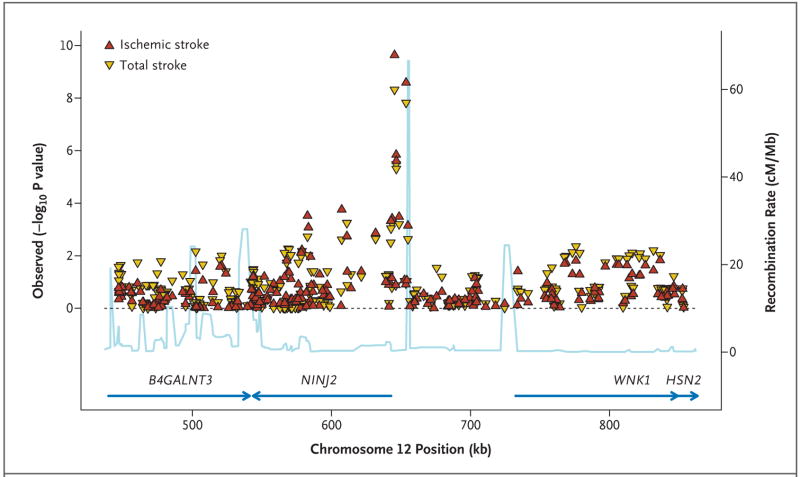
Results: Two intergenic single-nucleotide polymorphisms on chromosome 12p13 and within 11 kb of the gene NINJ2 were associated with stroke (P<5x10(-8)). NINJ2 encodes an adhesion molecule expressed in glia and shows increased expression after nerve injury. Direct genotyping showed that rs12425791 was associated with an increased risk of total (i.e., all types) and ischemic stroke, with hazard ratios of 1.30 (95% confidence interval [CI], 1.19 to 1.42) and 1.33 (95% CI, 1.21 to 1.47), respectively, yielding population attributable risks of 11% and 12% in the discovery cohorts. Corresponding hazard ratios were 1.35 (95% CI, 1.01 to 1.79; P=0.04) and 1.42 (95% CI, 1.06 to 1.91; P=0.02) in the large cohort of black persons and 1.17 (95% CI, 1.01 to 1.37; P=0.03) and 1.19 (95% CI, 1.01 to 1.41; P=0.04) in the Dutch sample; the results of an underpowered analysis of the smaller black cohort were nonsignificant.
Conclusions: A genetic locus on chromosome 12p13 is associated with an increased risk of stroke.
2009 Massachusetts Medical Society
Figures
Comment in
-
Genomewide association studies of stroke.N Engl J Med. 2009 Aug 13;361(7):722; author reply 722. doi: 10.1056/NEJMc091089. N Engl J Med. 2009. PMID: 19675338 No abstract available.
-
Failure to validate association between 12p13 variants and ischemic stroke.N Engl J Med. 2010 Apr 22;362(16):1547-50. doi: 10.1056/NEJMc0910050. N Engl J Med. 2010. PMID: 20410525 Free PMC article. No abstract available.
References
-
- Rosamond W, Flegal K, Furie K, et al. Heart disease and stroke statistics — 2008 update: a report from the American Heart Association Statistics Committee and Stroke Statistics Subcommittee. Circulation. 2008;117(4):e25–e146. - PubMed
-
- Bak S, Gaist D, Sindrup SH, Skytthe A, Christensen K. Genetic liability in stroke: a long-term follow-up study of Danish twins. Stroke. 2002;33:769–74. - PubMed
-
- Liao D, Myers R, Hunt S, et al. Familial history of stroke and stroke risk: the Family Heart Study. Stroke. 1997;28:1908–12. - PubMed
-
- Jousilahti P, Rastenyte D, Tuomilehto J, Sarti C, Vartiainen E. Parental history of cardiovascular disease and risk of stroke: a prospective follow-up of 14371 middle-aged men and women in Finland. Stroke. 1997;28:1361–6. - PubMed
-
- Dichgans M. Genetics of ischaemic stroke. Lancet Neurol. 2007;6:149–61. - PubMed
Publication types
MeSH terms
Substances
Grants and funding
- N01 HC055016/HL/NHLBI NIH HHS/United States
- R01 NS017950/NS/NINDS NIH HHS/United States
- N01 HC055019/HL/NHLBI NIH HHS/United States
- N01 HC075150/HC/NHLBI NIH HHS/United States
- N01 HC055015/HC/NHLBI NIH HHS/United States
- DK063491/DK/NIDDK NIH HHS/United States
- U01HL080295/HL/NHLBI NIH HHS/United States
- N01 HC045133/HC/NHLBI NIH HHS/United States
- N01 HC035129/HC/NHLBI NIH HHS/United States
- N01 HC055016/HC/NHLBI NIH HHS/United States
- R01HL086694/HL/NHLBI NIH HHS/United States
- UL1RR025005/RR/NCRR NIH HHS/United States
- N02-HL-6-4278/HL/NHLBI NIH HHS/United States
- N01-HC-25195/HC/NHLBI NIH HHS/United States
- N01 HC055022/HC/NHLBI NIH HHS/United States
- R01 AG016495/AG/NIA NIH HHS/United States
- N01 HC085081/HC/NHLBI NIH HHS/United States
- R01HL59367/HL/NHLBI NIH HHS/United States
- UL1 RR025005/RR/NCRR NIH HHS/United States
- U01 HL080295/HL/NHLBI NIH HHS/United States
- N01-HC-55022/HC/NHLBI NIH HHS/United States
- N01-HC-85081/HC/NHLBI NIH HHS/United States
- R01 HL059367/HL/NHLBI NIH HHS/United States
- N01 HC055021/HL/NHLBI NIH HHS/United States
- N01 HC015103/HC/NHLBI NIH HHS/United States
- N01-HC-55016/HC/NHLBI NIH HHS/United States
- N01 HC085083/HC/NHLBI NIH HHS/United States
- M01 RR000069/RR/NCRR NIH HHS/United States
- N01 HC085086/HL/NHLBI NIH HHS/United States
- N01 HC055018/HC/NHLBI NIH HHS/United States
- N01 HC025195/HC/NHLBI NIH HHS/United States
- R01 HL086694/HL/NHLBI NIH HHS/United States
- N01 HC085085/HC/NHLBI NIH HHS/United States
- N01 HC055015/HL/NHLBI NIH HHS/United States
- AG033193/AG/NIA NIH HHS/United States
- R01 HL087652/HL/NHLBI NIH HHS/United States
- N01-HC-55021/HC/NHLBI NIH HHS/United States
- HHSN268200625226C/PHS HHS/United States
- U01 HG004402/HG/NHGRI NIH HHS/United States
- N01-HC-85086/HC/NHLBI NIH HHS/United States
- NS17950/NS/NINDS NIH HHS/United States
- U01HG004402/HG/NHGRI NIH HHS/United States
- AG08122/AG/NIA NIH HHS/United States
- N01 HC055020/HL/NHLBI NIH HHS/United States
- N01 HC085082/HC/NHLBI NIH HHS/United States
- N01-HC-85082/HC/NHLBI NIH HHS/United States
- N01 HC055019/HC/NHLBI NIH HHS/United States
- P30 DK063491/DK/NIDDK NIH HHS/United States
- N01 HC085080/HC/NHLBI NIH HHS/United States
- R01 AG008122/AG/NIA NIH HHS/United States
- N01-HC-55019/HC/NHLBI NIH HHS/United States
- N01 HC025195/HL/NHLBI NIH HHS/United States
- R01 AG033193/AG/NIA NIH HHS/United States
- R01HL087641/HL/NHLBI NIH HHS/United States
- N01-HC-55015/HC/NHLBI NIH HHS/United States
- N01 HC055222/HL/NHLBI NIH HHS/United States
- N01 HC055222/HC/NHLBI NIH HHS/United States
- N01-HC-55222/HC/NHLBI NIH HHS/United States
- M01RR00069/RR/NCRR NIH HHS/United States
- N01 HC085079/HL/NHLBI NIH HHS/United States
- N01-HC-85083/HC/NHLBI NIH HHS/United States
- N01-HC-75150/HC/NHLBI NIH HHS/United States
- N01-HC-55020/HC/NHLBI NIH HHS/United States
- N01-HC-85080/HC/NHLBI NIH HHS/United States
- N01 HC055021/HC/NHLBI NIH HHS/United States
- N01 HC055018/HL/NHLBI NIH HHS/United States
- N01 HC085084/HC/NHLBI NIH HHS/United States
- R01HL087652/HL/NHLBI NIH HHS/United States
- AG16495/AG/NIA NIH HHS/United States
- N01-HC-85079/HC/NHLBI NIH HHS/United States
- N01 HC055020/HC/NHLBI NIH HHS/United States
- P30 AG010129/AG/NIA NIH HHS/United States
- N01 HC085079/HC/NHLBI NIH HHS/United States
- N01 HC075150/HL/NHLBI NIH HHS/United States
- N01-HC-55018/HC/NHLBI NIH HHS/United States
- R01 HL087641/HL/NHLBI NIH HHS/United States
LinkOut - more resources
Full Text Sources
Other Literature Sources
Medical
Molecular Biology Databases