

Pi3K-mTOR signaling and AMOG expression in epilepsy-associated glioneuronal tumors
- PMID: 19371356
- PMCID: PMC8094642
- DOI: 10.1111/j.1750-3639.2009.00268.x
Pi3K-mTOR signaling and AMOG expression in epilepsy-associated glioneuronal tumors
Abstract
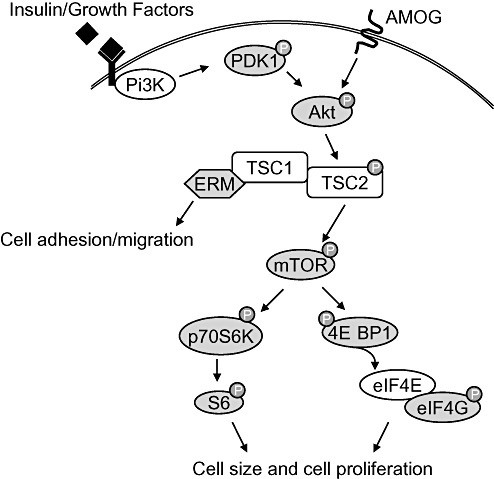
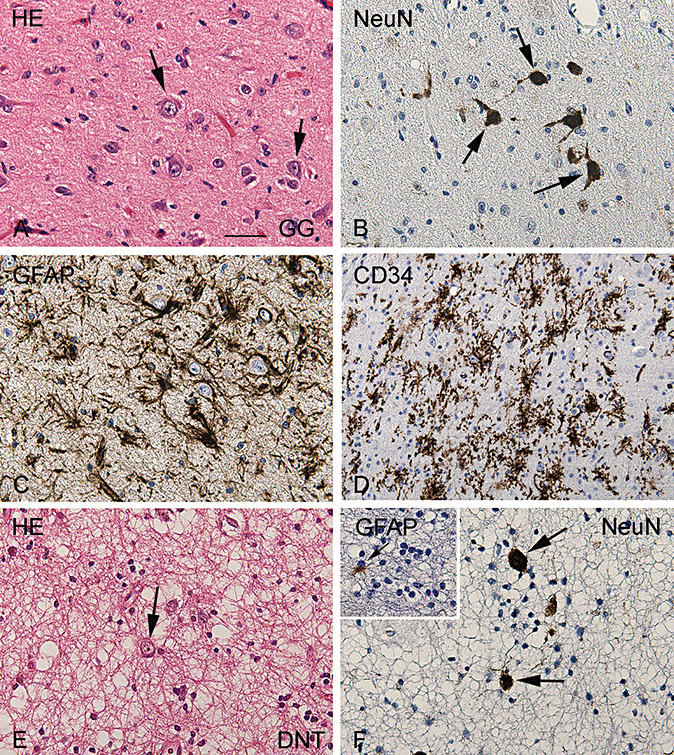
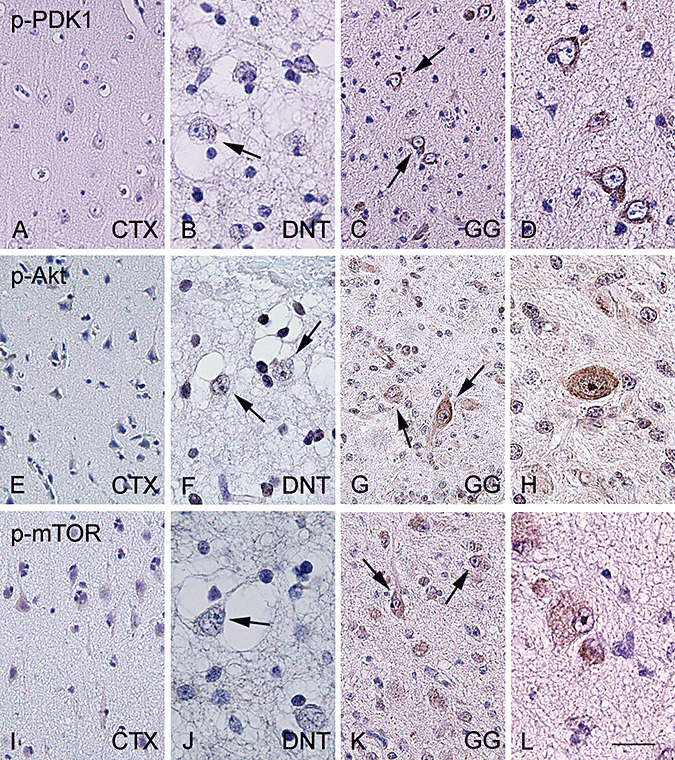
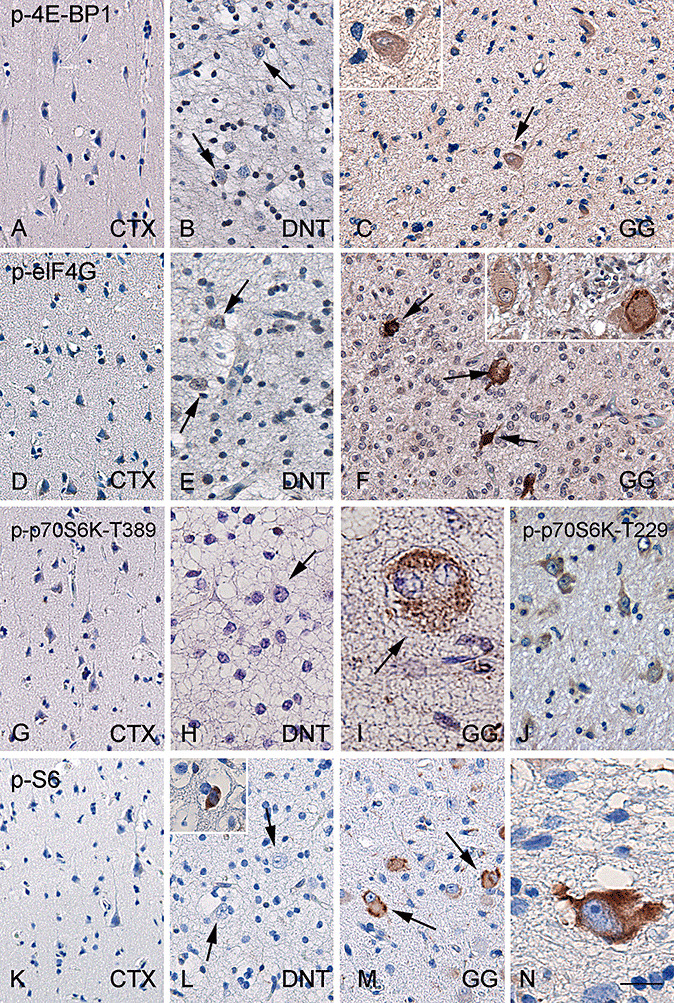
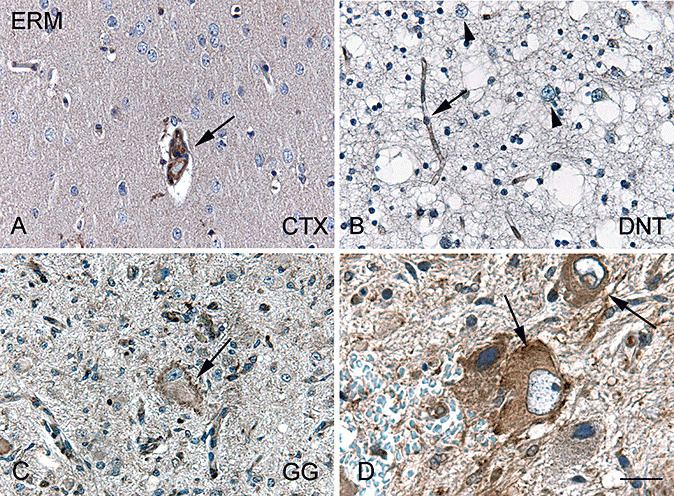
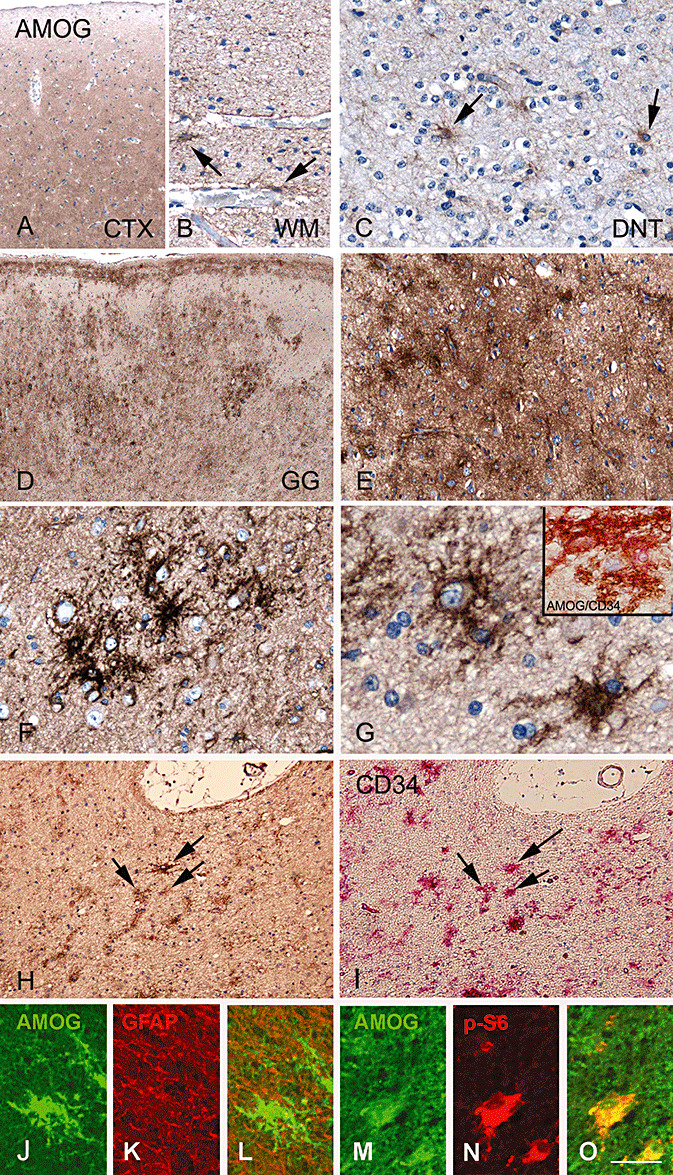
Gangliogliomas (GGs) and dysembryoplastic neuroepithelial tumors (DNTs) represent the most frequent type of neoplasms in pediatric medically intractable epilepsy. Several data suggest a pathogenetic relationship between GGs and other glioneuronal malformations of cortical development (MCDs), including activation of the Pi3K-mTOR signaling pathway. To further reveal these pathogenetic similarities, we investigated immunocytochemically the expression of phosphorylated (p)-PDK1, p-AKT, p-mTOR, p-4E-BP1, p-eIF4G, p-p70S6K and p-S6, the effector proteins ERM (ezrin/radixin/moesin) and the pathway regulator AMOG (adhesion molecule on glia) in both GGs and DNTs. Components of the Pi3K-mTOR signaling pathway were observed in a higher percentage of neuronal cells in GGs compared with control cortex. In DNTs, the expression of these components was low and comparable with the expression in control samples. Strong immunoreactivity for ERM was observed in GGs, but not in DNTs. Additionally, AMOG was strongly expressed within GGs (but not in DNTs) in CD34-positive precursor cells. These findings support the previously suggested pathogenic relationship between GG and MCDs concerning activation of the Pi3K-mTOR signaling pathway and suggest a different pathogenetic origin for DNTs. The strong expression of AMOG within the precursor cells of GG may represent an additional marker for the diagnostic evaluation of these glioneuronal lesions.
Figures
Similar articles
-
Expression patterns of AMOG in developing human cortex and malformations of cortical development.Epilepsy Res. 2010 Sep;91(1):84-93. doi: 10.1016/j.eplepsyres.2010.06.015. Epub 2010 Jul 24. Epilepsy Res. 2010. PMID: 20656459
-
Alterations of phosphatidylinositol 3-kinase pathway components in epilepsy-associated glioneuronal lesions.Epilepsia. 2007;48 Suppl 5:65-73. doi: 10.1111/j.1528-1167.2007.01291.x. Epilepsia. 2007. PMID: 17910583 Review.
-
Expression of CD34 as a novel marker for glioneuronal lesions associated with chronic intractable epilepsy.Neuropathol Appl Neurobiol. 2006 Oct;32(5):461-8. doi: 10.1111/j.1365-2990.2006.00734.x. Neuropathol Appl Neurobiol. 2006. PMID: 16972880
-
Akt-dependent cell size regulation by the adhesion molecule on glia occurs independently of phosphatidylinositol 3-kinase and Rheb signaling.Mol Cell Biol. 2005 Apr;25(8):3151-62. doi: 10.1128/MCB.25.8.3151-3162.2005. Mol Cell Biol. 2005. PMID: 15798201 Free PMC article.
-
Molecular neuropathology of epilepsy-associated glioneuronal malformations.J Neuropathol Exp Neurol. 2006 Feb;65(2):99-108. doi: 10.1097/01.jnen.0000199570.19344.33. J Neuropathol Exp Neurol. 2006. PMID: 16462201 Review.
Cited by
-
mTOR signaling in epilepsy: insights from malformations of cortical development.Cold Spring Harb Perspect Med. 2015 Apr 1;5(4):a022442. doi: 10.1101/cshperspect.a022442. Cold Spring Harb Perspect Med. 2015. PMID: 25833943 Free PMC article. Review.
-
Perspectives for Ezrin and Radixin in Astrocytes: Kinases, Functions and Pathology.Int J Mol Sci. 2019 Aug 2;20(15):3776. doi: 10.3390/ijms20153776. Int J Mol Sci. 2019. PMID: 31382374 Free PMC article. Review.
-
GLUT1 and Cerebral Glucose Hypometabolism in Human Focal Cortical Dysplasia Is Associated with Hypermethylation of Key Glucose Regulatory Genes.Mol Neurobiol. 2025 Aug;62(8):10264-10276. doi: 10.1007/s12035-025-04871-z. Epub 2025 Apr 7. Mol Neurobiol. 2025. PMID: 40195216 Free PMC article.
-
Frontier of epilepsy research - mTOR signaling pathway.Exp Mol Med. 2011 May 31;43(5):231-74. doi: 10.3858/emm.2011.43.5.032. Exp Mol Med. 2011. PMID: 21467839 Free PMC article. Review.
-
Evidence for mTOR pathway activation in a spectrum of epilepsy-associated pathologies.Acta Neuropathol Commun. 2014 Jul 8;2:71. doi: 10.1186/2051-5960-2-71. Acta Neuropathol Commun. 2014. PMID: 25005575 Free PMC article.
References
-
- Aronica E, Leenstra S, Van Veelen CW, Van Rijen PC, Hulsebos TJ, Tersmette AC et al (2001) Glioneuronal tumors and medically intractable epilepsy: a clinical study with long‐term follow‐up of seizure outcome after surgery. Epilepsy Res 43:179–191. - PubMed
-
- Aronica E, Boer K, Baybis M, Yu J, Crino PB (2007) Co‐expression of cyclin d1 and phosphorylated ribosomal s6 proteins in hemimegalencephaly. Acta Neuropathol 114:287–293. - PubMed
-
- Aronica E, Boer K, Becker A, Redeker S, Spliet WG, Van Rijen PC et al (2008) Gene expression profile analysis of epilepsy‐associated gangliogliomas. Neuroscience 151:272–292. - PubMed
-
- Astrinidis A, Henske EP (2005) Tuberous sclerosis complex: linking growth and energy signaling pathways with human disease. Oncogene 24:7475–7481. - PubMed
-
- Barkovich AJ, Kuzniecky RI, Jackson GD, Guerrini R, Dobyns WB (2005) A developmental and genetic classification for malformations of cortical development. Neurology 65:1873–1887. - PubMed
Publication types
MeSH terms
Substances
LinkOut - more resources
Full Text Sources
Other Literature Sources
Medical
Research Materials
Miscellaneous
