. 2009;8(3):33.
doi: 10.1186/jbiol130. Epub 2009 Apr 16.

Conservation of core gene expression in vertebrate tissues

Affiliations

Conservation of core gene expression in vertebrate tissues

Esther T Chan et al. J Biol. 2009.

Abstract

Background: Vertebrates share the same general body plan and organs, possess related sets of genes, and rely on similar physiological mechanisms, yet show great diversity in morphology, habitat and behavior. Alteration of gene regulation is thought to be a major mechanism in phenotypic variation and evolution, but relatively little is known about the broad patterns of conservation in gene expression in non-mammalian vertebrates.

Results: We measured expression of all known and predicted genes across twenty tissues in chicken, frog and pufferfish. By combining the results with human and mouse data and considering only ten common tissues, we have found evidence of conserved expression for more than a third of unique orthologous genes. We find that, on average, transcription factor gene expression is neither more nor less conserved than that of other genes. Strikingly, conservation of expression correlates poorly with the amount of conserved nonexonic sequence, even using a sequence alignment technique that accounts for non-collinearity in conserved elements. Many genes show conserved human/fish expression despite having almost no nonexonic conserved primary sequence.

Conclusions: There are clearly strong evolutionary constraints on tissue-specific gene expression. A major challenge will be to understand the precise mechanisms by which many gene expression patterns remain similar despite extensive cis-regulatory restructuring.


Figures
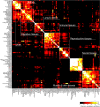
Figure 1
Figure 1
Comparison of tissue expression profiles among five diverse vertebrates. Clustered heat map of the all-versus-all Pearson correlation matrix between 20 tissues in each of human (H), mouse (M), chicken (C), frog (F) and pufferfish (P) over all 3,074 1-1-1-1-1 orthologs. Analogous and functionally related tissues are boxed in white, demonstrating the cross-species similarity of those tissues on the basis of their gene expression profiles.
Figure 2
Figure 2
Conservation of gene expression using the binary measure. (a) Proportion of conservation events out of total possible conservation events at different thresholds using the binary model. (b) Proportion of genes with at least one conservation event among the ten common tissues out of all 3,074 measured genes using the binary model. See Results and Materials and methods for details.
Figure 3
Figure 3
Cumulative distributions comparing the pairwise conservation of gene expression of each species versus human using the Pearson correlation measure. Data shown use median-subtracted asinh values (comparable to ratios). The dotted lines are negative controls derived using permuted data. C, chicken; F, frog; H, human; M, mouse; P, pufferfish.
Figure 4
Figure 4
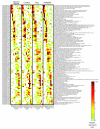
A core conserved vertebrate tissue transcriptome. Expression ratios of the measured and predicted expression patterns of 1,488 1-1-1-1-1 orthologs as described in the text and Materials and methods are shown. Two-dimensional hierarchical agglomerative clustering using a distance metric of 1 – Pearson correlation followed by clustering and diagonalization [44] was applied to the expression ratios of each ortholog in each tissue over all five datasets.
Figure 5
Figure 5
Comparison of gene expression conservation to evolutionary distance. The scatter plots show expression distance as 1 – Pearson correlation, using median-subtracted asinh values (comparable to ratios). (a) Median pairwise correlation over all genes; each point represents a pair of species. (b) Median pairwise correlation over all tissues; each point represents a pair of species. (c) Individual pairwise correlations over tissues, as indicated with colors; each point represents a single tissue in a single pair of species. Estimated species divergence times were obtained from [48].
Figure 6
Figure 6
Relationship between expression similarity between orthologous genes and amount of conserved nonexonic sequence. Proportion of conserved nonexonic sequence defined as Phastcons elements (a, b) and human bases in non-collinear alignment (c, d) compared against the conservation of gene expression by the binary measure (a, c) and Pearson measure (normalized intensities) versus pufferfish (P) (b, d) (see text and Materials and methods for details). Selected TFs are indicated in (b) (see text). Probable TFs as determined by their Ensembl gene descriptions, but that were not identified by our domain analyses, are indicated by †. Spearman rho refers to the Spearman correlation coefficient.
Figure 7
Figure 7
Low correlation between conservation of gene expression and amount of conserved nonexonic sequence is largely independent of evolutionary distance. (a) Scatter plots show the proportion of bases conserved in SCE alignments versus Pearson correlation (ratios) for individual genes. (b) Box plots show the distribution of Pearson correlations for genes in the top and bottom quartiles of number of conserved bases. Asterisks indicate significant differences between the top and bottom quartiles.
Figure 8
Figure 8
Expression of 102 genes with highly conserved expression across all vertebrate lineages, but no detectable nonexonic sequence conservation between pufferfish and frog, chicken, mouse, or human. Mouse and human expression profiles are merged to represent mammals. Gene identifiers and descriptions for human were downloaded from Ensembl.

Similar articles

Cited by

References

    1. International Chicken Genome Sequencing Consortium Sequence and comparative analysis of the chicken genome provide unique perspectives on vertebrate evolution. Nature. 2004;432:695–716. doi: 10.1038/nature03154. - DOI - PubMed
    1. International Human Genome Sequencing Consortium Finishing the euchromatic sequence of the human genome. Nature. 2004;431:931–945. doi: 10.1038/nature03001. - DOI - PubMed
    1. Jaillon O, Aury JM, Brunet F, Petit JL, Stange-Thomann N, Mauceli E, Bouneau L, Fischer C, Ozouf-Costaz C, Bernot A, Nicaud S, Jaffe D, Fisher S, Lutfalla G, Dossat C, Segurens B, Dasilva C, Salanoubat M, Levy M, Boudet N, Castellano S, Anthouard V, Jubin C, Castelli V, Katinka M, Vacherie B, Biémont C, Skalli Z, Cattolico L, Poulain J, et al. Genome duplication in the teleost fish Tetraodon nigroviridis reveals the early vertebrate protokaryotype. Nature. 2004;431:946–957. doi: 10.1038/nature03025. - DOI - PubMed
    1. Mouse Genome Sequencing Consortium. Waterston RH, Lindblad-Toh K, Birney E, Rogers J, Abril JF, Agarwal P, Agarwala R, Ainscough R, Alexandersson M, An P, Antonarakis SE, Attwood J, Baertsch R, Bailey J, Barlow K, Beck S, Berry E, Birren B, Bloom T, Bork P, Botcherby M, Bray N, Brent MR, Brown DG, Brown SD, Bult C, Burton J, Butler J, Campbell RD, et al. Initial sequencing and comparative analysis of the mouse genome. Nature. 2002;420:520–562. doi: 10.1038/nature01262. - DOI - PubMed
    1. King MC, Wilson AC. Evolution at two levels in humans and chimpanzees. Science. 1975;188:107–116. doi: 10.1126/science.1090005. - DOI - PubMed

Publication types