

Two types of inhibitory influences target different groups of taste-responsive cells in the nucleus of the solitary tract of the rat
- PMID: 19371730
- PMCID: PMC2699607
- DOI: 10.1016/j.brainres.2009.03.069
Two types of inhibitory influences target different groups of taste-responsive cells in the nucleus of the solitary tract of the rat
Abstract
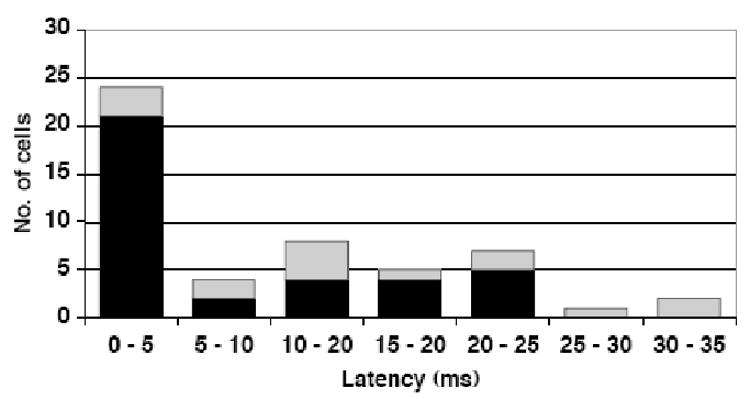
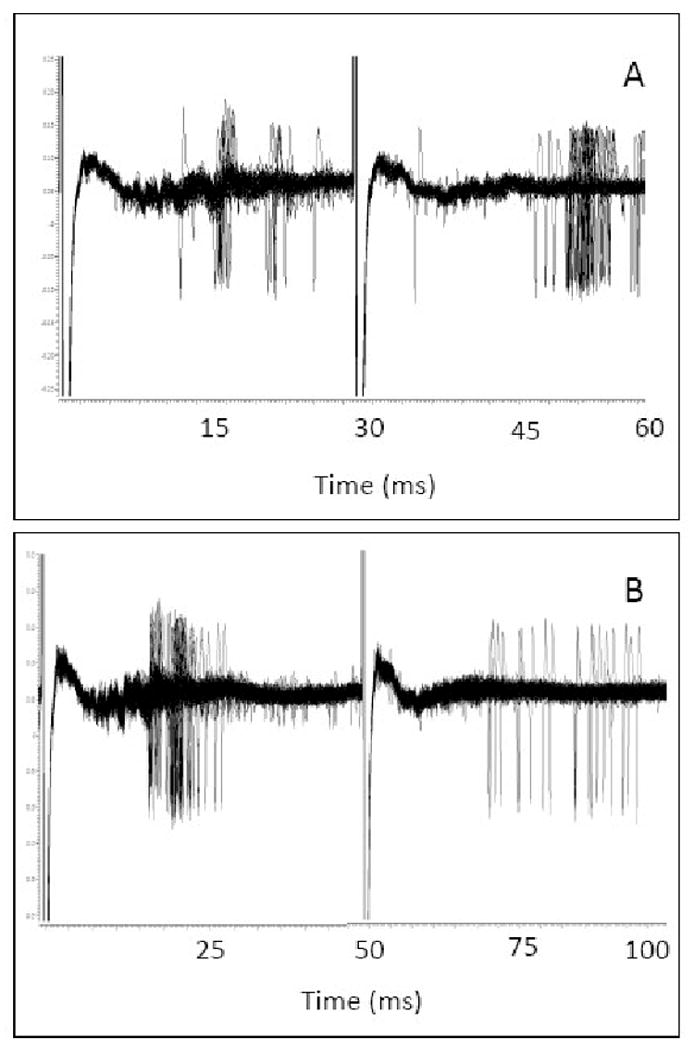
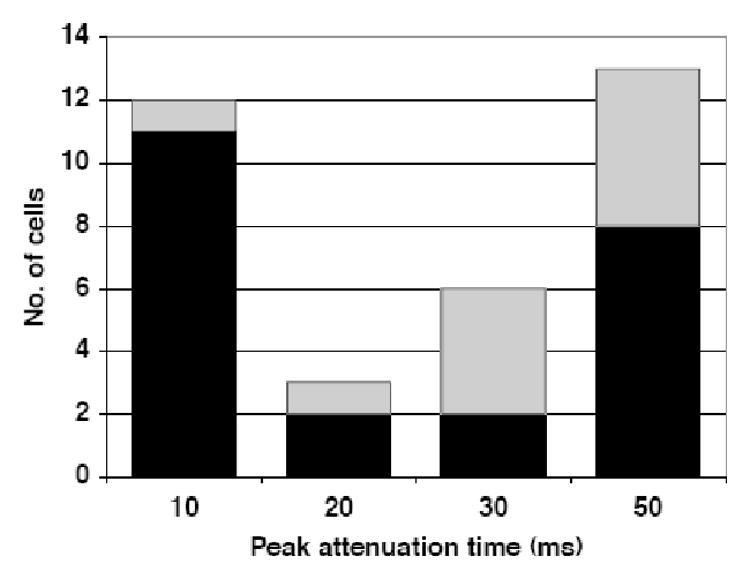
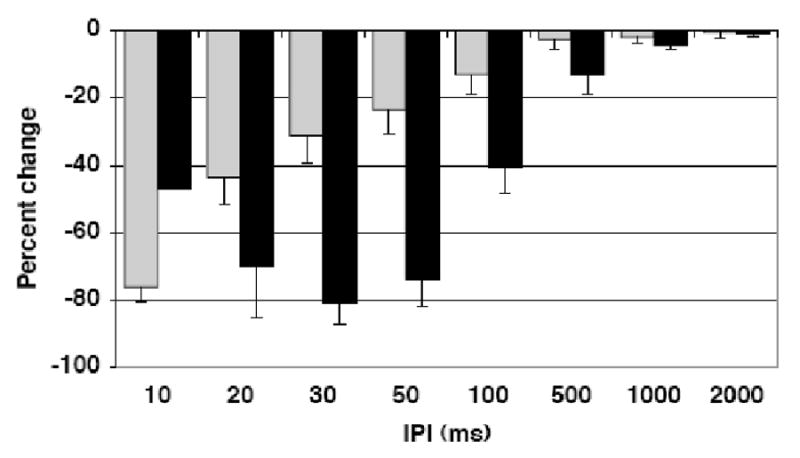
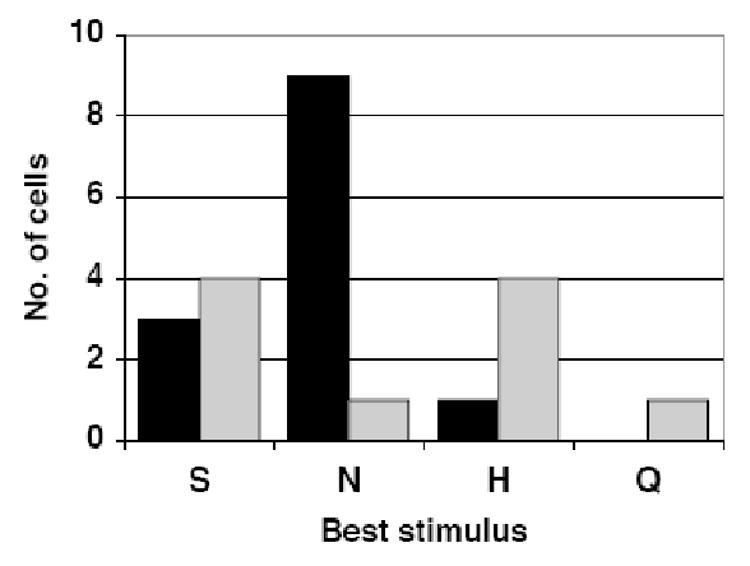
Electrical stimulation of the chorda tympani nerve (CT; innervating taste buds on the rostral tongue) is known to initiate recurrent inhibition in cells in the nucleus of the solitary tract (NTS, the first central relay in the gustatory system). Here, we explored the relationship between inhibitory circuits and the breadth of tuning of taste-responsive NTS neurons. Initially, NTS cells with evoked responses to electrical stimulation of the CT (0.1 ms pulses; 1 Hz) were tested with each of four tastants (0.1 M NaCl, 0.01 M HCl, 0.01 M quinine and 0.5 M sucrose) in separate trials. Next, the CT was electrically stimulated using a paired-pulse (10-2000 ms interpulse interval; blocks of 100 trials) paradigm. Forty-five (30 taste-responsive) of 51 cells with CT-evoked responses (36 taste-responsive) were tested with paired pulses. The majority (34; 75.6%) showed paired-pulse attenuation, defined as fewer evoked spikes in response to the second (test) pulse compared with the first (conditioning) pulse. A bimodal distribution of the peak of paired-pulse attenuation was found with modes at 10 ms and 50 ms in separate groups of cells. Cells with early peak attenuation showed short CT-evoked response latencies and large responses to relatively few taste stimuli. Conversely, cells with late peak attenuation showed long CT-evoked response latencies and small taste responses with less selectivity. Results suggest that the breadth of tuning of an NTS cell may result from the combination of the sensitivities of peripheral nerve inputs and the recurrent influences generated by the circuitry of the NTS.
Figures
Similar articles
-
Effects of electrical stimulation of the chorda tympani nerve on taste responses in the nucleus of the solitary tract.J Neurophysiol. 2002 Nov;88(5):2477-89. doi: 10.1152/jn.00094.2002. J Neurophysiol. 2002. PMID: 12424287
-
Effects of electrical stimulation of the glossopharyngeal nerve on cells in the nucleus of the solitary tract of the rat.Brain Res. 2006 Oct 3;1113(1):163-73. doi: 10.1016/j.brainres.2006.07.029. Epub 2006 Aug 14. Brain Res. 2006. PMID: 16904656
-
Neural coding of taste by simultaneously recorded cells in the nucleus of the solitary tract of the rat.J Neurophysiol. 2012 Dec;108(12):3301-12. doi: 10.1152/jn.00566.2012. Epub 2012 Sep 26. J Neurophysiol. 2012. PMID: 23019002 Free PMC article.
-
Neural circuits for taste. Excitation, inhibition, and synaptic plasticity in the rostral gustatory zone of the nucleus of the solitary tract.Ann N Y Acad Sci. 1998 Nov 30;855:467-74. doi: 10.1111/j.1749-6632.1998.tb10607.x. Ann N Y Acad Sci. 1998. PMID: 9929640 Review.
-
Neural plasticity in the gustatory system.Nutr Rev. 2004 Nov;62(11 Pt 2):S208-17; discussion S224-41. doi: 10.1111/j.1753-4887.2004.tb00101.x. Nutr Rev. 2004. PMID: 15630937 Free PMC article. Review.
Cited by
-
A computational analysis of signal fidelity in the rostral nucleus of the solitary tract.J Neurophysiol. 2018 Mar 1;119(3):771-785. doi: 10.1152/jn.00624.2017. Epub 2017 Nov 1. J Neurophysiol. 2018. PMID: 29093172 Free PMC article.
-
Synaptic characteristics of rostral nucleus of the solitary tract neurons with input from the chorda tympani and glossopharyngeal nerves.Brain Res. 2010 Apr 30;1328:71-8. doi: 10.1016/j.brainres.2010.03.003. Epub 2010 Mar 6. Brain Res. 2010. PMID: 20214892 Free PMC article.
-
Taste-specific cell assemblies in a biologically informed model of the nucleus of the solitary tract.J Neurophysiol. 2010 Jul;104(1):4-17. doi: 10.1152/jn.01098.2009. Epub 2010 May 5. J Neurophysiol. 2010. PMID: 20445036 Free PMC article.
-
Water as an independent taste modality.Front Neurosci. 2010 Oct 15;4:175. doi: 10.3389/fnins.2010.00175. eCollection 2010. Front Neurosci. 2010. PMID: 21048894 Free PMC article.
-
Enhancing GABAergic Tone in the Rostral Nucleus of the Solitary Tract Reconfigures Sensorimotor Neural Activity.J Neurosci. 2021 Jan 20;41(3):489-501. doi: 10.1523/JNEUROSCI.0388-20.2020. Epub 2020 Nov 24. J Neurosci. 2021. PMID: 33234608 Free PMC article.
References
-
- Bradley RM, Grabauskas G. Neural circuits for taste. Excitation, inhibition, and synaptic plasticity in the rostral gustatory zone of the nucleus of the solitary tract. Ann N Y Acad Sci. 1998;855:467–474. - PubMed
-
- Cho YK, Mao L, Li CS. Modulation of solitary taste neurons by electrical stimulation of the ventroposteromedial nucleus of the thalamus in the hamster. Brain Res. 2008;1221:67–79. - PubMed
-
- Cho YK, Li CS, Smith DV. Descending influences from the lateral hypothalamus and amygdala converge on medullary taste neurons. Chem Senses. 2003;28:155–171. - PubMed
-
- Davis BJ, Kream RM. Distribution of tachykinin- and opioid-expressing neurons in the hamster solitary nucleus: an immuno- and in situ hybridization histochemical study. Brain Res. 1993;616(12):6–16. - PubMed
-
- Di Lorenzo PM. The neural code for taste in the brain stem: Response profiles. Physiol Behav. 2000;69(12):87–96. - PubMed
Publication types
MeSH terms
Grants and funding
LinkOut - more resources
Full Text Sources
