. 2009 Jun;106(6):2016-25.
doi: 10.1152/japplphysiol.00295.2009. Epub 2009 Apr 16.

Temperature alters solute transport in growth plate cartilage measured by in vivo multiphoton microscopy

Affiliations

Temperature alters solute transport in growth plate cartilage measured by in vivo multiphoton microscopy

Maria A Serrat et al. J Appl Physiol (1985). 2009 Jun.

Abstract

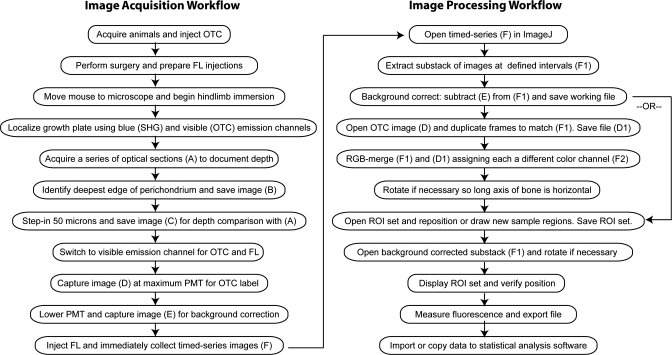
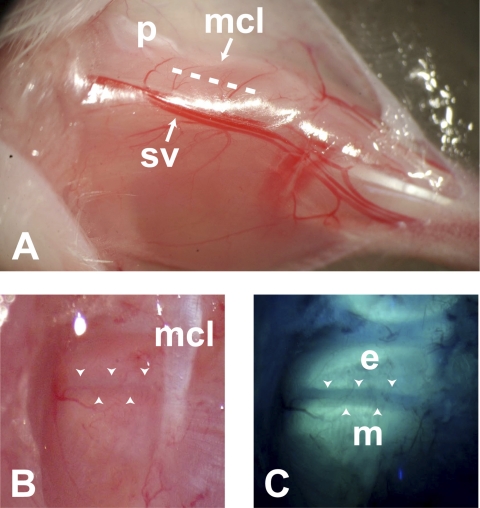
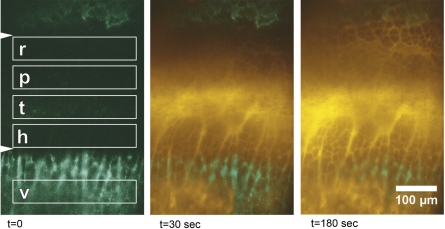
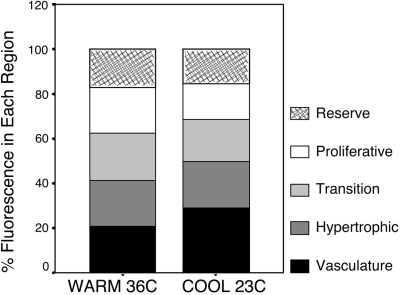
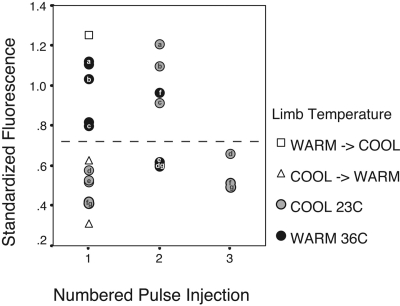
Solute delivery to avascular cartilaginous plates is critical to bone elongation, and impaired transport of nutrients and growth factors in cartilage matrix could underlie many skeletal abnormalities. Advances in imaging technology have revolutionized our ability to visualize growth plates in vivo, but quantitative methods are still needed. We developed analytical standards for measuring solute delivery, defined by amount and rate of intravenous tracer entry, in murine growth plates using multiphoton microscopy. We employed an acute temperature model because of its well-established impact on bone circulation and tested the hypothesis that solute delivery changes positively with limb temperature when body core and respiration are held constant (36 degrees C, 120 breaths/min). Tibial growth plates were surgically exposed in anesthetized 5-wk-old mice, and their hindlimbs were immersed in warm (36 degrees C) or cool (23 degrees C) saline (n = 6/group). After 30 min of thermal equilibration, we administered an intracardiac injection of fluorescein (50 microl, 0.5%) and captured sequentially timed growth plate images spanning 10 min at standardized depth. Absolute growth plate fluorescence was normalized to vascular concentrations for interanimal comparisons. As predicted, more fluorescein infiltrated growth plates at 36 degrees C, with standardized values nearly double those at 23 degrees C. Changing initial limb temperature did not alter baseline values, suggesting a sustained response period. These data validate the sensitivity of our system and have relevance to strategies for enhancing localized delivery of therapeutic agents to growth plates of children. Applications of this technique include assessment of solute transport in models of growth plate dysfunction, particularly chondrodysplasias with matrix irregularities.


Figures

Fig. 1.
Fig. 1.
Long bone schematic illustrating the growth plate and its principal blood supplies: epiphyseal vessels, metaphyseal vessels, and a subperichondrial ring vessel plexus around the periphery. Vasculature is shown at left. The growth plate comprises a heterogeneous collection of chondrocytes located between the ossified epiphysis and metaphysis of immature long bones. Growth plates are conventionally subdivided into 4 morphologically and functionally distinct zones: reserve (R), proliferative (P), proliferative-hypertrophic transition (T), and hypertrophic (H) (right). Bone elongation occurs through a series of well-orchestrated events in which chondrocytes in columns divide, mature, and are replaced with mineral at the chondro-osseous junction, where bone-forming osteoblasts invade from the metaphyseal vasculature (V).
Fig. 2.
Fig. 2.
Multiphoton images of vessels in the subperichondrial plexus from the same mouse with its limb bathed in cool (23°C) and then changed to warm (37°C) lactated Ringer saline. The growth plate is oriented as in Fig. 1. Images were captured 30 min apart at the same growth plate depth and location, verified in a series of optical sections imaged superficial to deep. Vessels were visualized at 780-nm illumination after an intravenous injection of fluorescein (FL) so that the plasma is fluorescent (white) and blood cells appear as dark shadows within the vessels. Vessels were enlarged after the switch to the warmer temperature (arrows).
Fig. 3.
Fig. 3.
Workflow diagram illustrating key steps in image acquisition and processing procedures. See text for details.
Fig. 4.
Fig. 4.
Surgical approach to the proximal tibial growth plate. The limb is extended with the hindpaw to the right and the patella (p) at the top of the image (A). An incision (dashed line) is made through the superficial fascia of the biceps femoris and gastrocnemius muscles between the medial collateral ligament (mcl) and saphenous vessels (sv). Images at bottom are oriented as in Fig. 1. Under bright-field dissection (B), the growth plate appears as a dark band (between the arrowheads) caudal to the medial collateral ligament. The perichondrium, vascular network, and joint capsule remain intact. UV illumination (C) reveals oxytetracycline (OTC) fluorescence in epiphyseal (e) and metaphyseal (m) bone, which denotes boundaries of the growth plate (arrowheads).
Fig. 5.
Fig. 5.
Time-lapse multiphoton images illustrating FL (yellow pseudocolor) entering the growth plate within seconds (t) after intracardiac injection. Orientation matches that in Fig. 1. OTC label (green pseudocolor) of epiphyseal (top) and metaphyseal (bottom) bone facilitates localization of the growth plate, which appears between the arrowheads in the far left frame. Boxes depict sample regions for measuring fluorescence in reserve (r), proliferative (p), transitional (t), and hypertrophic (h) subdivisions of the growth plate, as well as in the vasculature (v) of the metaphyseal bone. Although the conventional terminology used in Fig. 1 is upheld for simplicity, these sample regions were not strictly confined to the standard growth plate zones, and boxes may have included cells from adjacent morphological territories.
Fig. 6.
Fig. 6.
Scatter plots illustrating absolute fluorescence in combined sample regions of the growth plate (A) and vasculature (B) at warm and cool limb temperatures over time. The warm outlier with unusually high values in the growth plate and vasculature inflates interanimal variation. Standardizing growth plate values to 8-min vascular concentrations (C) considerably reduces the range of variation, since fluorescence values in the growth plate and vasculature are highly correlated (D) (Pearson's r = 0.94, P < 0.001). See text for discussion of reference point selection.
Fig. 7.
Fig. 7.
Stacked bar graph illustrating the spatial distribution of FL in subdivisions of the growth plate and vasculature 8 min after intracardiac injection. Regions correspond to boxes shown in Fig. 5. Each box represents a percentage of the total fluorescence measured among all 5 regions so that the total shown is 100%. At warm temperature, FL was distributed evenly among all sample areas (∼20% per region). In the cold, FL was distributed nearly equally among growth plate compartments, with slightly more in the transition (18.6%) and hypertrophic (21%) regions compared with reserve (15.7%) and proliferative (15.8%), but a greater percentage of the tracer (28.9%) remained in the cold vasculature compared with the warm group.
Fig. 8.
Fig. 8.
Timed accumulation curves of fluorescein in the growth plate (all subdivisions combined) standardized to 8-min vascular concentrations. Values are means ± SE for each group at 1-min intervals spanning 10 min after intracardiac injection. Mean values in the warm temperature were nearly double those measured at cool temperature.
Fig. 9.
Fig. 9.
Repeated FL injections after a change in limb immersion temperature. Plots show fluorescence in the growth plate standardized to 8-min vascular concentrations. Up to 3 FL injections were administered to each animal at different limb temperatures, allowing at least 30 min of thermal equilibration between injections. Letters a–g correspond to individual mice. The dashed horizontal line separates the ranges found at warm and cool baseline (injection 1). For each repeated injection after a temperature change (injections 2 and 3), FL levels were primarily found within the range of those measured at baseline, regardless of the secondary or tertiary injection temperature. When limb temperature was changed before the first injection was administered, FL values were found within the baseline ranges, rather than those of the actual injection temperature (□, warm baseline switched to cool temperature for the first injection; ▵, cool baseline switched to warm temperature for the injection). These results suggest a sustained physiological response to the initial temperature exposure. See text for further discussion.

Similar articles

Cited by

References

    1. Aigner T, Rau T, Niederhagen M, Zaucke F, Schmitz M, Pöhls U, Stöss H, Rauch A, Thiel CT. Achondrogenesis type IA (Houston-Harris): a still unresolved molecular phenotype. Pediatr Dev Pathol 10: 328–334, 2007. - PubMed
    1. Akorn. AK-FLUOR Fluorescein Injection, USP (Online). http://www.akorn.com/documents/catalog/sell_sheets/17478-253-10.pdf?PHPS... [2009].
    1. Alman BA Skeletal dysplasias and the growth plate. Clin Genet 73: 24–30, 2008. - PubMed
    1. Ang C, Dawes J. The effects of hyperthermia on human endothelial monolayers: modulation of thrombotic potential and permeability. Blood Coagul Fibrinolysis 5: 193–199, 1994. - PubMed
    1. Arkill KP, Winlove CP. Solute transport in the deep and calcified zones of articular cartilage. Osteoarthritis Cartilage 16: 708–714, 2008. - PubMed

Publication types