. 2009 May 12;106(19):7695-701.
doi: 10.1073/pnas.0902340106. Epub 2009 Apr 16.

A transcriptomic analysis of superhybrid rice LYP9 and its parents

Affiliations

A transcriptomic analysis of superhybrid rice LYP9 and its parents

Gang Wei et al. Proc Natl Acad Sci U S A. .

Abstract

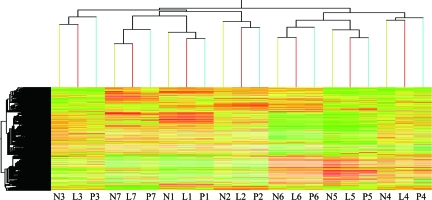
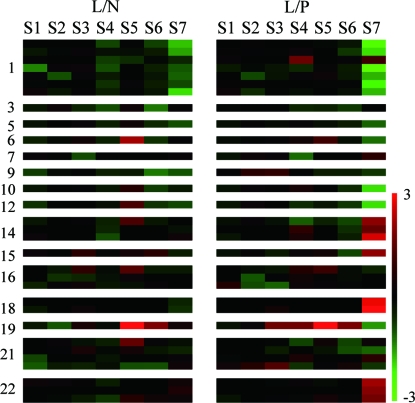
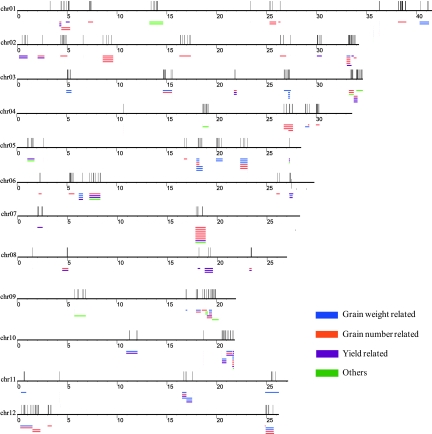
By using a whole-genome oligonucleotide microarray, designed based on known and predicted indica rice genes, we investigated transcriptome profiles in developing leaves and panicles of superhybrid rice LYP9 and its parental cultivars 93-11 and PA64s. We detected 22,266 expressed genes out of 36,926 total genes set collectively from 7 tissues, including leaves at seedling and tillering stages, flag leaves at booting, heading, flowering, and filling stages, and panicles at filling stage. Clustering results showed that the F1 hybrid's expression profiles resembled those of its parental lines more than that which lies between the 2 parental lines. Out of the total gene set, 7,078 genes are shared by all sampled tissues and 3,926 genes (10.6% of the total gene set) are differentially expressed genes (DG). As we divided DG into those between the parents (DG(PP)) and between the hybrid and its parents (DG(HP)), the comparative results showed that genes in the categories of energy metabolism and transport are enriched in DG(HP) rather than in DG(PP). In addition, we correlated the concurrence of DG and yield-related quantitative trait loci, providing a potential group of heterosis-related genes.


Conflict of interest statement

The authors declare no conflict of interest.

Figures

Fig. 1.
Fig. 1.
Hierarchical clustering analysis of all gene models based on expression data. Normalized expression values for the microarray (37K) clustered with Genespring (Silicon Genetics). Each horizontal line refers to a gene. The color represents the logarithmic intensity of the expressed genes. N, L, and P stand for 93-11, LYP9, and PA64s, respectively. Numbers 1–7 denote samples from the following tissues in order: seedling shoot, leaf at tillering stage, flag leaf at booting stage, flag leaf at heading stage, flag leaf at flowering stage, flag leaf at filling stage, and panicle at filling stage.
Fig. 2.
Fig. 2.
Expression profiles of DG between LYP9 and its parents in carbohydrate biosynthesis pathway. Genes involved in carbohydrate metabolism were identified according to their Enzyme Commission annotation, and those genes that differentially expressed at least once were shown. The log2-transformed ratio between the hybrid and either parent was used (L, LYP9; N, 9311; P, PA64s). Each row represents a single gene, and the number indicates a group of isoenzymes in the pathway according to its position in the path and order. Red and green colors denote up- and down-regulated genes, respectively. The genes are listed as follows: (1) ribulose-bisphosphate carboxylase, (3) glyceraldehyde-3-phosphate dehydrogenase, (5) fructose-bisphosphate aldolase, (6) fructose-bisphosphatase, (7) glucose-6-phosphate isomerase, (9) transketolase, (10) sedoheptulose-1,7-bisphosphatase (SBPase), (12) phosphoribulokinase, (14) ADP-glucose pyrophosphorylase, (15) UDP-glucose pyrophosphorylase, (16) sucrose-P synthase, (18) sucrose synthase, (19) invertase, (21) starch synthase, and (22) branching enzyme.
Fig. 3.
Fig. 3.
Distribution of DG located in yield-category QTL of small intervals. Yield-category QTL of small intervals (number of genes ≤100) that harbor DGHP were aligned to TIGR's rice pseudochromosome version 5. The long horizontal lines represent 12 rice chromosomes, the short horizontal lines represent QTL intervals, and the short vertical lines represent DGHP.

References

    1. Bennetzen JL. Comparative sequence analysis of plant nuclear genomes: Microcolinearity and its many exceptions. Plant Cell. 2000;12:1021–1029. - PMC - PubMed
    1. Fu H, Dooner HK. Intraspecific violation of genetic colinearity and its implications in maize. Proc Natl Acad Sci USA. 2002;99:9573–9578. - PMC - PubMed
    1. Birchler JA, Auger DL, Riddle NC. In search of the molecular basis of heterosis. Plant Cell. 2003;15:2236–2239. - PMC - PubMed
    1. Song R, Messing J. Gene expression of a gene family in maize based on noncollinear haplotypes. Proc Natl Acad Sci USA. 2003;100:9055–9060. - PMC - PubMed
    1. Guo M, et al. Allelic variation of gene expression in maize hybrids. Plant Cell. 2004;16:1707–1716. - PMC - PubMed

Publication types

Associated data