

Endocytosis is required for E-cadherin redistribution at mature adherens junctions
- PMID: 19372377
- PMCID: PMC2678428
- DOI: 10.1073/pnas.0811253106
Endocytosis is required for E-cadherin redistribution at mature adherens junctions
Erratum in
-
Correction for de Beco et al., Endocytosis is required for E-cadherin redistribution at mature adherens junctions.Proc Natl Acad Sci U S A. 2020 Sep 15;117(37):23191. doi: 10.1073/pnas.2017143117. Epub 2020 Sep 8. Proc Natl Acad Sci U S A. 2020. PMID: 32900943 Free PMC article. No abstract available.
Abstract
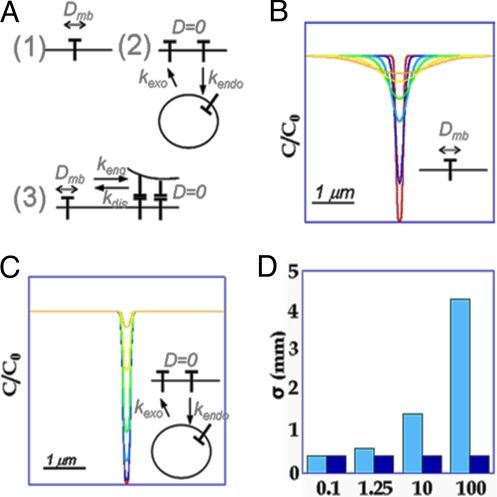
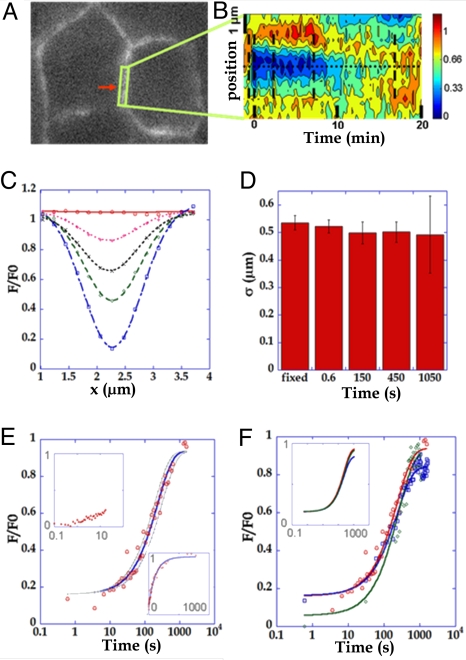
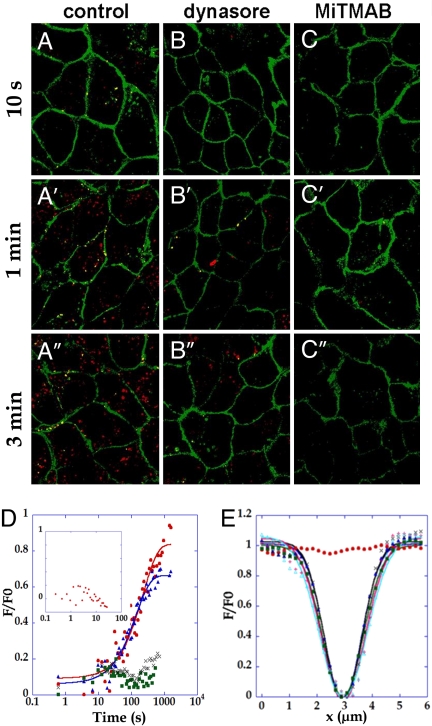
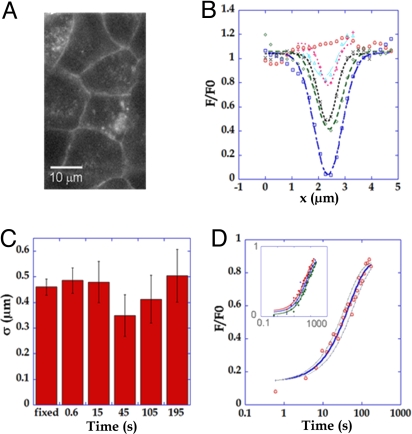
E-cadherin plays a key role at adherens junctions between epithelial cells, but the mechanisms controlling its assembly, maintenance, and dissociation from junctions remain poorly understood. In particular, it is not known to what extent the number of E-cadherins engaged at junctions is regulated by endocytosis, or by dissociation of adhesive bonds and redistribution within the membrane from a pool of diffusive cadherins. To determine whether cadherin levels at mature junctions are regulated by endocytosis or dissociation and membrane diffusion, the dynamics of E-cadherin were quantitatively analyzed by a new approach combining 2-photon fluorescence recovery after photobleaching (FRAP) and fast 3D wide-field fluorescence microscopy. Image analysis of fluorescence recovery indicates that most E-cadherin did not diffuse in the membrane along mature junctions, but followed a first order turn-over process that was rate-limited by endocytosis. In confluent cultures of MCF7 or MDCK cells, stably expressed EGFP-E-cadherin was rapidly recycled with spatially uniform kinetics (50 s in MCF7 and 4 min in MDCK). In addition, when endocytosis was pharmacologically blocked by dynasore or MiTMAB, no fluorescence recovery was observed, suggesting that no endocytosis-independent membrane redistribution was occurring. Our data show that membrane redistribution of E-cadherin molecules engaged in mature junctions requires endocytosis and subsequent exocytosis, and lead to the notion that E-cadherins engaged at junctions do not directly revert to free membrane diffusion. Our results point to the possibility that a direct mechanical coupling between endocytosis efficiency and cadherin-mediated forces at junctions could help to regulate intercellular adhesion and locally stabilize epithelia.
Conflict of interest statement
The authors declare no conflict of interest.
Figures
Similar articles
-
Mechanosensitive Adaptation of E-Cadherin Turnover across adherens Junctions.PLoS One. 2015 Jun 5;10(6):e0128281. doi: 10.1371/journal.pone.0128281. eCollection 2015. PLoS One. 2015. PMID: 26046627 Free PMC article.
-
E-cadherin dynamics is regulated by galectin-7 at epithelial cell surface.Sci Rep. 2017 Dec 6;7(1):17086. doi: 10.1038/s41598-017-17332-y. Sci Rep. 2017. PMID: 29213102 Free PMC article.
-
Use of photoactivation and photobleaching to monitor the dynamic regulation of E-cadherin at the plasma membrane.Cell Adh Migr. 2010 Oct-Dec;4(4):491-501. doi: 10.4161/cam.4.4.12661. Cell Adh Migr. 2010. PMID: 20595808 Free PMC article.
-
New insights into the regulation of E-cadherin distribution by endocytosis.Int Rev Cell Mol Biol. 2012;295:63-108. doi: 10.1016/B978-0-12-394306-4.00008-3. Int Rev Cell Mol Biol. 2012. PMID: 22449487 Review.
-
Adherens junction turnover: regulating adhesion through cadherin endocytosis, degradation, and recycling.Subcell Biochem. 2012;60:197-222. doi: 10.1007/978-94-007-4186-7_9. Subcell Biochem. 2012. PMID: 22674073 Free PMC article. Review.
Cited by
-
Cortical tension initiates the positive feedback loop between cadherin and F-actin.Biophys J. 2022 Feb 15;121(4):596-606. doi: 10.1016/j.bpj.2022.01.006. Epub 2022 Jan 11. Biophys J. 2022. PMID: 35031276 Free PMC article.
-
The Toll/NF-κB signaling pathway is required for epidermal wound repair in Drosophila.Proc Natl Acad Sci U S A. 2014 Dec 16;111(50):E5373-82. doi: 10.1073/pnas.1408224111. Epub 2014 Nov 26. Proc Natl Acad Sci U S A. 2014. PMID: 25427801 Free PMC article.
-
The interdependence of the Rho GTPases and apicobasal cell polarity.Small GTPases. 2014;5(2):10. doi: 10.4161/21541248.2014.973768. Small GTPases. 2014. PMID: 25469537 Free PMC article. Review.
-
Mechanosensitive Adaptation of E-Cadherin Turnover across adherens Junctions.PLoS One. 2015 Jun 5;10(6):e0128281. doi: 10.1371/journal.pone.0128281. eCollection 2015. PLoS One. 2015. PMID: 26046627 Free PMC article.
-
Different dynamin blockers interfere with distinct phases of synaptic endocytosis during stimulation in motoneurones.J Physiol. 2015 Jul 1;593(13):2867-88. doi: 10.1113/JP270112. Epub 2015 Jun 10. J Physiol. 2015. PMID: 25981717 Free PMC article.
References
-
- Gumbiner BM. Regulation of cadherin-mediated adhesion in morphogenesis. Nat Rev Mol Cell Biol. 2005;6:622–634. - PubMed
-
- Takeichi M. Morphogenetic roles of classic cadherins. Curr Opin Cell Biol. 1995;7:619–627. - PubMed
-
- Yap AS. The morphogenetic role of cadherin cell adhesion molecules in human cancer: A thematic review. Cancer Invest. 1998;16:252–261. - PubMed
-
- Leckband D, Sivasankar S. Mechanism of homophilic cadherin adhesion. Curr Opin Cell Biol. 2000;12:587–592. - PubMed
Publication types
MeSH terms
Substances
LinkOut - more resources
Full Text Sources
Other Literature Sources
Miscellaneous
