. 2009 Apr 28;106(17):7028-33.
doi: 10.1073/pnas.0900028106. Epub 2009 Apr 16.

Progressive lengthening of 3' untranslated regions of mRNAs by alternative polyadenylation during mouse embryonic development

Affiliations

Progressive lengthening of 3' untranslated regions of mRNAs by alternative polyadenylation during mouse embryonic development

Zhe Ji et al. Proc Natl Acad Sci U S A. .

Abstract

The 3' untranslated regions (3' UTRs) of mRNAs contain cis-acting elements for posttranscriptional regulation of gene expression. Here, we report that mouse genes tend to express mRNAs with longer 3' UTRs as embryonic development progresses. This global regulation is controlled by alternative polyadenylation and coordinates with initiation of organogenesis and aspects of embryonic development, including morphogenesis, differentiation, and proliferation. Using myogenesis of C2C12 myoblast cells as a model, we recapitulated this process in vitro and found that 3' UTR lengthening is likely caused by weakening of mRNA polyadenylation activity. Because alternative 3' UTR sequences are typically longer and have higher AU content than constitutive ones, our results suggest that lengthening of 3' UTR can significantly augment posttranscriptional control of gene expression during embryonic development, such as microRNA-mediated regulation.


Conflict of interest statement

The authors declare no conflict of interest.

Figures
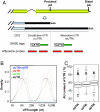
Fig. 1.
Fig. 1.
Alternative polyadenylation (APA) leading to alternative 3′ UTRs. (A) Schematics of APA in the 3′-most exon and using SAGE tags and Affymetrix GeneChip probes to examine APA. Two transcript variants resulting from proximal and distal poly(A) sites are shown. The dotted vertical line separates 2 UTR regions, i.e., constitutive UTR (cUTR) and alternative UTR (aUTR). CDS, coding sequence; pA, poly(A) site; AAA, poly(A) tail. (B) Distribution of length for different UTR groups. The full 3′ UTRs for genes with APA are shown by cUTR + aUTR [4,139 genes, median = 1,288 nucleotide (nt)]. Constitutive and alternative regions are represented by cUTR (median = 358 nt) and aUTR (median = 685 nt), respectively. sUTRs are 3′ UTRs not affected by APA (7,242 genes, median = 439 nt). (C) AU content for different UTR sequences.
Fig. 2.
Fig. 2.
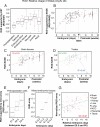
Progressive lengthening of 3′ UTR during mouse embryonic development. (A) Box plots of RUD-EST values for mouse developmental stages. The preimplantation group includes “cleavage,” “morula,” and “blastocyst.” Embryonic fetus corresponds to whole fetus, and embryonic tissues include different embryonic tissue types. Median values are connected by a red line. (B) Scatter plot of RUD-SAGE values vs. developmental time. Embryonic development is shown in days and postnatal development is shown in weeks. The 8th and 19th days are indicated by vertical gray lines. The data were fitted by a Lowess function (shown as a dotted red line). There are 32 tissue types in the graph. A total of 3,041 genes were used to calculate RUD-SAGE values. (C) Scatter plot of RUD-SAGE values vs. developmental time for brain tissues. All samples are shown as gray dots, and brain samples are boxed. Linear regression was used to fit the data. (D) As in C except that testis samples (boxed) were analyzed. Two linear regression lines were used, 1 for embryonic stages (green) and 1 for postnatal stages (blue). P0 was used for both stages. R2 values for the regression lines are indicated in the graphs. (E) Box plots of RUD-array values for preimplantation cells. (F) As in E except that mixed tissues were used. (G) Normalized RUD-array values for 8 embryonic tissue types. The normalized RUD-array values are RUD values standardized within each sample set. For each set, all time points are relative to the middle point, which was set at 0. Linear regression was used to detect the overall trend [Pearson correlation coefficient (CC) is indicated in the graph]. NCC, neural crest cells. Data sets used for A are shown in Table S1, those used for B are shown in Table S2, and those used for E, F, and G are shown in Table S3.
Fig. 3.
Fig. 3.
Regulation of 3′ UTR during C2C12 differentiation. (A) Analysis of 3′ UTR lengthening during C2C12 differentiation using 3′ array (Affymetrix Mouse 430 v2.0) data. Lanes 1 and 2 correspond to 50% and 90% cell confluency, respectively, for which cells are under the growth condition; and lanes 3–8 correspond to 6 h, 1 day, 2 days, 3 days, 4 days, and 5 days after induction of differentiation, respectively. (B) Correlation between RUD-array values and expression of gene sets during C2C12 differentiation. The negative correlation set (NCS) contains 59 genes, and the positive correlation set (PCS) contains 74 genes. Selection of these sets is shown in Fig. S2. Expression values for genes in each set were standardized across samples and averaged. RUD-array values are those shown in A. Left, correlation between RUD-array values and gene expression of PCS. Right, correlation between RUD-array values and gene expression of NCS. (C) Analysis of 3′ UTR lengthening during C2C12 differentiation using exon array (Affymetrix Mouse Exon 1.0 ST). Growth and differentiation conditions approximately correspond to 50% confluency and between +1 and +2 days in A, respectively. (D) Numbers of genes with significant change of APA during C2C12 differentiation based on comparison of probes in aUTRs with those in cUTRs. Different FDRs were used to select significant genes. The ratio of number of genes with 3′ UTR lengthened to that with 3′ UTR shortened are indicated. (E) Genes with APA that can be examined by exon array are plotted. y axis, change of intensity (differentiation vs. growth) for probes in aUTRs; x axis, change of intensity for probes in cUTRs. Genes with significant change of APA (FDR = 10%) are colored. Red, 3′ UTR lengthening (284 genes); green, 3′ UTR shortening (41 genes). (F) Schematic of constructs used to examine APA in C2C12 cells. pCMV, CMV promoter; RFP, red fluorescent protein; IRES, internal ribosome entry site; EGFP, enhance green fluorescent protein; AAA, poly(A) tail. (G) Relative usage of poly(A) sites in C2C12 cells under growth and differentiation conditions. The qRT-PCR value for the EGFP region was normalized to that for the RFP region for each sample. The value for 77S.AE under growth condition was used as reference and set at 1. Error bars are standard deviations based on triplicates.

References

    1. Wickens M, Anderson P, Jackson RJ. Life and death in the cytoplasm: Messages from the 3′ end. Curr Opin Genet Dev. 1997;7(2):220–232. - PubMed
    1. Keene JD. RNA regulons: Coordination of post-transcriptional events. Nat Rev Genet. 2007;8(7):533–543. - PubMed
    1. Garneau NL, Wilusz J, Wilusz CJ. The highways and byways of mRNA decay. Nat Rev Mol Cell Biol. 2007;8(2):113–126. - PubMed
    1. Filipowicz W, Bhattacharyya SN, Sonenberg N. Mechanisms of post-transcriptional regulation by microRNAs: Are the answers in sight? Nat Rev Genet. 2008;9(2):102–114. - PubMed
    1. Bartel DP. MicroRNAs: Target recognition and regulatory functions. Cell. 2009;136(2):215–233. - PMC - PubMed

Publication types

Substances