. 2009 Apr;8(4):914-20.
doi: 10.1158/1535-7163.MCT-08-0712.

Tautomycetin and tautomycin suppress the growth of medullary thyroid cancer cells via inhibition of glycogen synthase kinase-3beta

Affiliations

Tautomycetin and tautomycin suppress the growth of medullary thyroid cancer cells via inhibition of glycogen synthase kinase-3beta

Joel T Adler et al. Mol Cancer Ther. 2009 Apr.

Erratum in

  • Mol Cancer Ther. 2010 May;9(5):1482

Abstract

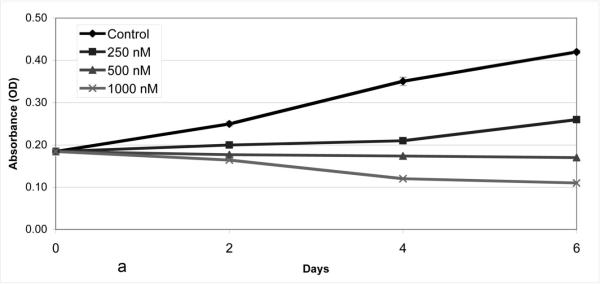
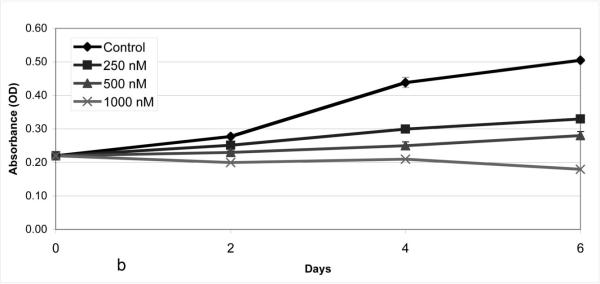
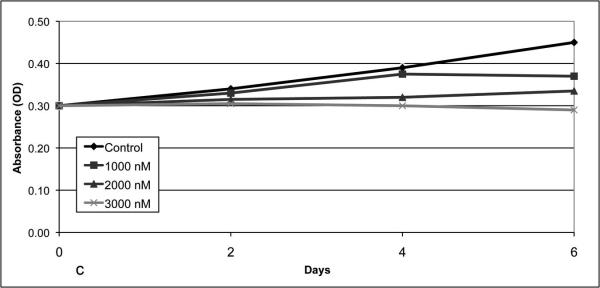
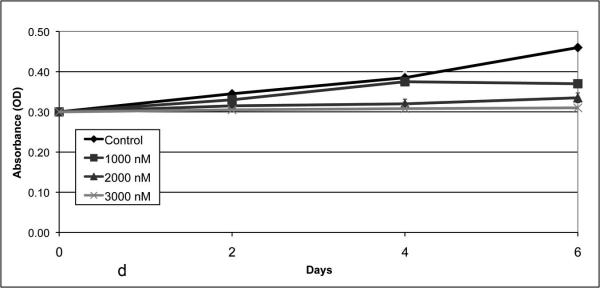
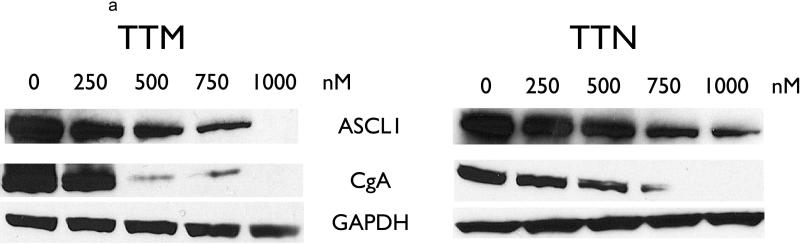
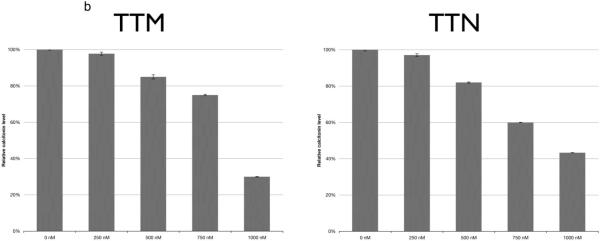
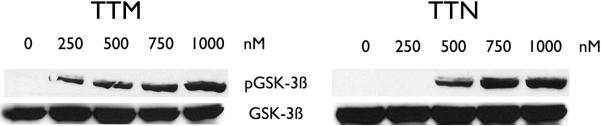
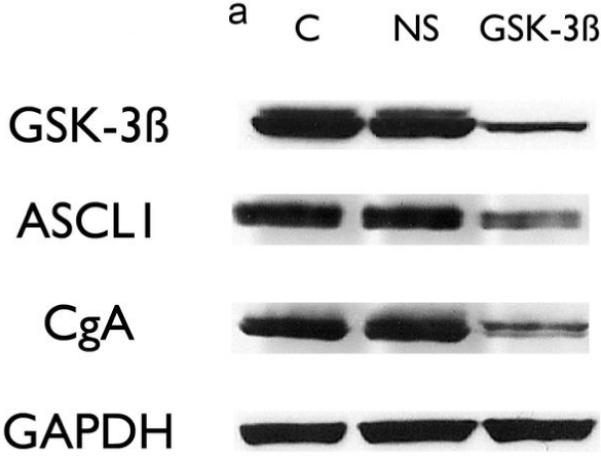
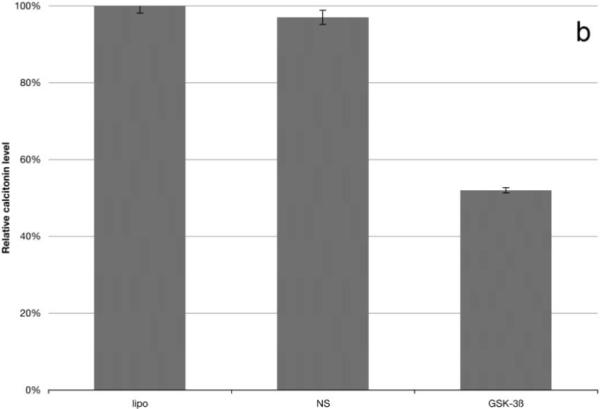
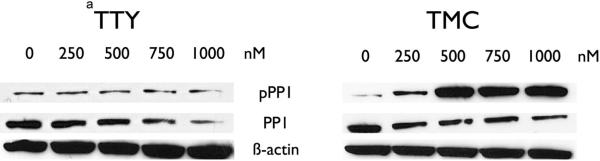
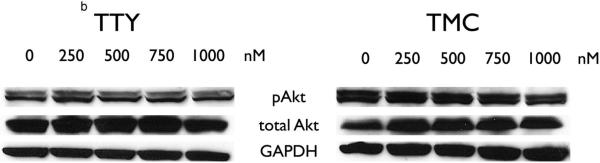
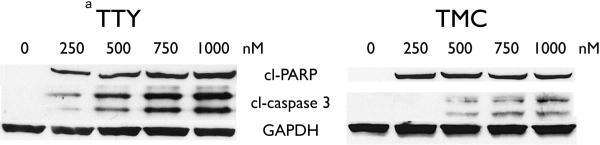
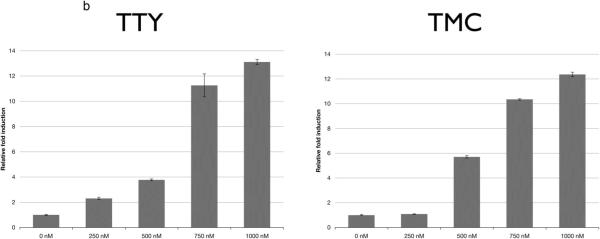
Medullary thyroid cancer (MTC) is a relatively uncommon neuroendocrine tumor that arises from the calcitonin-secreting parafollicular cells of the thyroid gland. Unfortunately, MTC frequently metastasizes, precluding curative surgical resection and causing significant morbidity. Thus, there is an urgent need for new treatment modalities. Tautomycin and tautomycetin are antifungal antibiotics isolated from Streptomyces spiroverticillatus and Streptomyces griseochromogens, respectively. Glycogen synthase kinase-3beta is a serine/threonine protein kinase that regulates multiple cellular processes and is important in various cancers, including MTC. Treatment with tautomycin and tautomycetin decreased neuroendocrine markers, suppressed hormonal secretion, and inhibited growth through apoptosis in MTC cells. Importantly, we describe a novel action of these compounds: inhibition of glycogen synthase kinase-3beta.


Figures

Figure 1
Figure 1
TTY and TMC inhibit the growth of MTC cells. MTC cells were treated with the indicated concentrations of TTY (Figure 1a) and TMC (Figure 1b) for up to 6 days, while murine fibroblast cells were treated with the indicated concentrations of TMC (Figure 1c) and TTY (Figure 1d). Cell viability was determined by an MTT colorimetric growth assay. Points represent mean +/− SE. All treatments of MTC cells were significantly different from control after two days of treatment (P < 0.01, one-way ANOVA), while treatment was significantly different after six days of treatment of murine fibroblast cells.
Figure 1
Figure 1
TTY and TMC inhibit the growth of MTC cells. MTC cells were treated with the indicated concentrations of TTY (Figure 1a) and TMC (Figure 1b) for up to 6 days, while murine fibroblast cells were treated with the indicated concentrations of TMC (Figure 1c) and TTY (Figure 1d). Cell viability was determined by an MTT colorimetric growth assay. Points represent mean +/− SE. All treatments of MTC cells were significantly different from control after two days of treatment (P < 0.01, one-way ANOVA), while treatment was significantly different after six days of treatment of murine fibroblast cells.
Figure 2
Figure 2
TTY and TMC decrease NE markers in MTC cells. Treatment for 2 days with TTY or TMC decreased the NE markers ASCL1, a pro-neuroendocrine gene, and CgA, a marker of hormonal secretion in a dose-dependent manner (Figure 2a). GAPDH is shown as a loading control. To confirm that treatment with TTY and TMC suppressed hormonal secretion, a calcitonin ELISA was performed (Figure 2b). TTY and TMC caused a significant dose-dependent hormonal suppression, with a decrease of 70% and 67%, respectively, at the highest doses used (P < 0.001 for both, one-way ANOVA).
Figure 2
Figure 2
TTY and TMC decrease NE markers in MTC cells. Treatment for 2 days with TTY or TMC decreased the NE markers ASCL1, a pro-neuroendocrine gene, and CgA, a marker of hormonal secretion in a dose-dependent manner (Figure 2a). GAPDH is shown as a loading control. To confirm that treatment with TTY and TMC suppressed hormonal secretion, a calcitonin ELISA was performed (Figure 2b). TTY and TMC caused a significant dose-dependent hormonal suppression, with a decrease of 70% and 67%, respectively, at the highest doses used (P < 0.001 for both, one-way ANOVA).
Figure 3
Figure 3
TTY and TMC inhibit GSK-3ß in MTC cells. GSK-3ß, in contrast to other kinases, becomes inactivated by phosphorylation in response to signaling cascades. Treatment for 2 days with TTY or TMC phosphorylated GSK-3ß in a dose-dependent fashion, demonstrating inhibition of the pathway.
Figure 4
Figure 4
Knockdown of GSK-3ß decreases NE markers in MTC cells. MTC cells were transfected with lipofectamine as control, 75 nM non-specific siRNA, or 75 nM GSK-3ß siRNA for 2 days. GSK-3ß siRNA decreased the amount of GSK-3ß protein and decreased the NE markers ASCL1 and CgA (Figure 4a). A calcitonin ELISA confirmed that GSK-3ß inhibition significantly limited hormonal secretion (P = 0.02, independent samples T test, Figure 4b).
Figure 4
Figure 4
Knockdown of GSK-3ß decreases NE markers in MTC cells. MTC cells were transfected with lipofectamine as control, 75 nM non-specific siRNA, or 75 nM GSK-3ß siRNA for 2 days. GSK-3ß siRNA decreased the amount of GSK-3ß protein and decreased the NE markers ASCL1 and CgA (Figure 4a). A calcitonin ELISA confirmed that GSK-3ß inhibition significantly limited hormonal secretion (P = 0.02, independent samples T test, Figure 4b).
Figure 5
Figure 5
TTY and TMC affect GSK-3ß via PP1. MTC cells were treated with the indicated concentrations of TTY and TMC for 2 days, total cell lysates were prepared, and levels of PP1 were measured. An increase in the phosphorylation of PP1 was observed with TMC, and total levels of the PP1 protein decreased, suggesting decreased activity (Figure 5a). These results suggest that TTY and TMC function through PP1 to inhibit GSK-3ß, as reported in other cell lines. Moreover, TTY and TMC did not affect the phosphorylation of Akt at serine 473 (pAkt) or total amount of Akt, an upstream protein of GSK-3ß (Figure 5b). Therefore, TTY and TMC act through PP1 to inhibit GSK-3ß via phosphorylation.
Figure 5
Figure 5
TTY and TMC affect GSK-3ß via PP1. MTC cells were treated with the indicated concentrations of TTY and TMC for 2 days, total cell lysates were prepared, and levels of PP1 were measured. An increase in the phosphorylation of PP1 was observed with TMC, and total levels of the PP1 protein decreased, suggesting decreased activity (Figure 5a). These results suggest that TTY and TMC function through PP1 to inhibit GSK-3ß, as reported in other cell lines. Moreover, TTY and TMC did not affect the phosphorylation of Akt at serine 473 (pAkt) or total amount of Akt, an upstream protein of GSK-3ß (Figure 5b). Therefore, TTY and TMC act through PP1 to inhibit GSK-3ß via phosphorylation.
Figure 6
Figure 6
TTY and TMC cause growth inhibition via apoptosis. MTC cells were treated with the indicated concentrations of TTY and TMC for 2 days, and total cell lysates were prepared. An increase in the cleavage of PARP and caspase-3 suggests that the mechanism of growth inhibition is apoptosis (Figure 6a). GAPDH was used as a loading control. A DNA-fragmentation cell death ELISA was performed to confirm apoptosis (Figure 6b). Treatment with TTY and TMC caused a dose-dependent increase in DNA fragmentation, confirming that apoptosis occurred in MTC cells treated with TTY and TMC.
Figure 6
Figure 6
TTY and TMC cause growth inhibition via apoptosis. MTC cells were treated with the indicated concentrations of TTY and TMC for 2 days, and total cell lysates were prepared. An increase in the cleavage of PARP and caspase-3 suggests that the mechanism of growth inhibition is apoptosis (Figure 6a). GAPDH was used as a loading control. A DNA-fragmentation cell death ELISA was performed to confirm apoptosis (Figure 6b). Treatment with TTY and TMC caused a dose-dependent increase in DNA fragmentation, confirming that apoptosis occurred in MTC cells treated with TTY and TMC.

Similar articles

Cited by

References

    1. Greenblatt DY, Chen H. Palliation of advanced thyroid malignancies. Surg Oncol. 2007;16:237–47. - PubMed
    1. Sippel RS, Kunnimalaiyaan M, Chen H. Current management of medullary thyroid cancer. Oncologist. 2008;13:539–47. - PubMed
    1. Cohen P, Frame S. The renaissance of GSK3. Nat Rev Mol Cell Biol. 2001;2:769–76. - PubMed
    1. Patel DS, Dessalew N, Iqbal P, Bharatam PV. Structure-based approaches in the design of GSK-3 selective inhibitors. Curr Protein Pept Sci. 2007;8:352–64. - PubMed
    1. Garcea G, Manson MM, Neal CP, et al. Glycogen synthase kinase-3 beta; a new target in pancreatic cancer? Curr Cancer Drug Targets. 2007;7:209–15. - PubMed

Publication types

MeSH terms