

Quantitative proteomics investigation of pancreatic intraepithelial neoplasia
- PMID: 19373808
- PMCID: PMC2775073
- DOI: 10.1002/elps.200800752
Quantitative proteomics investigation of pancreatic intraepithelial neoplasia
Abstract
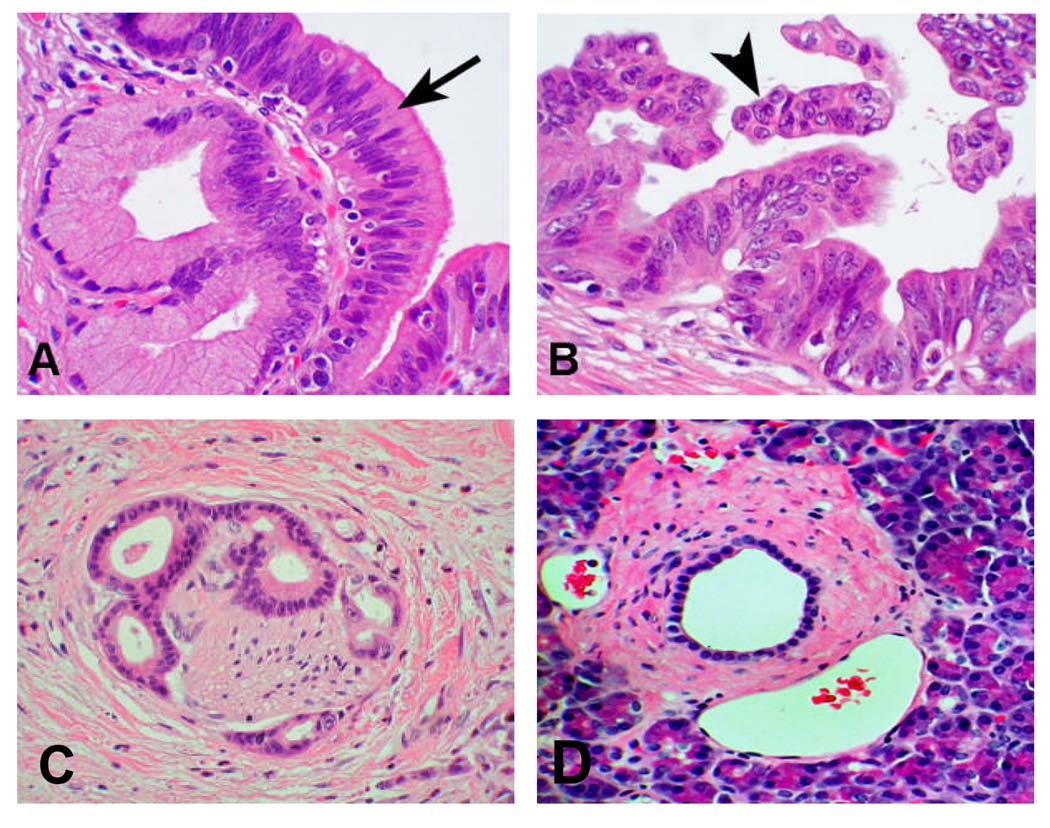
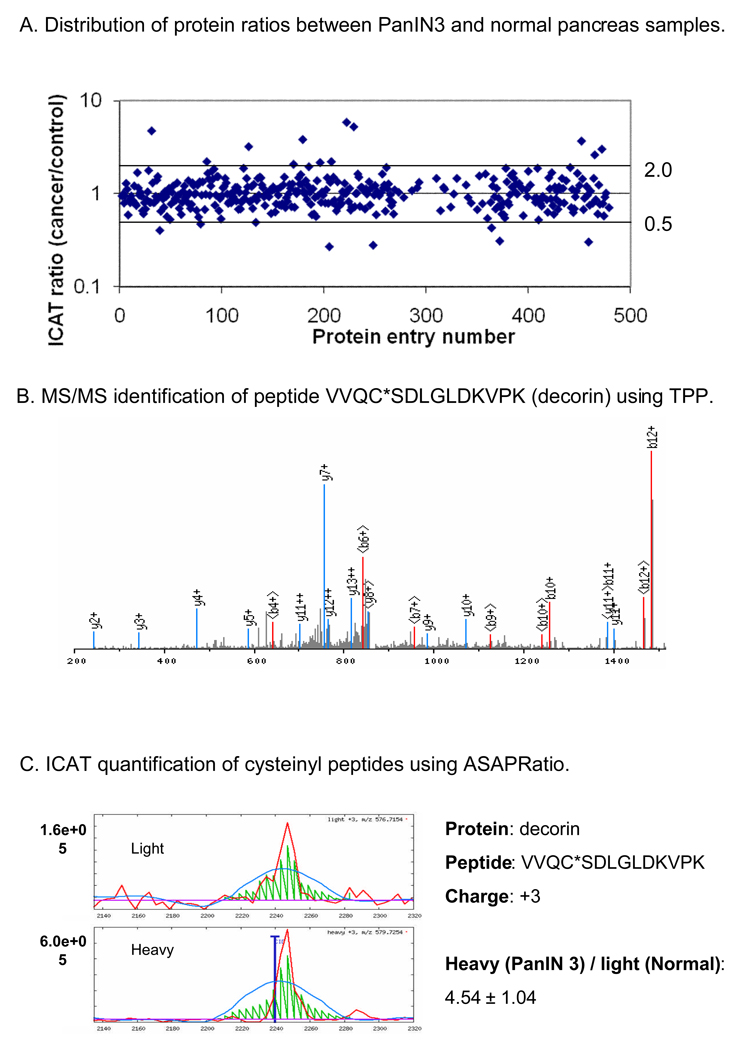
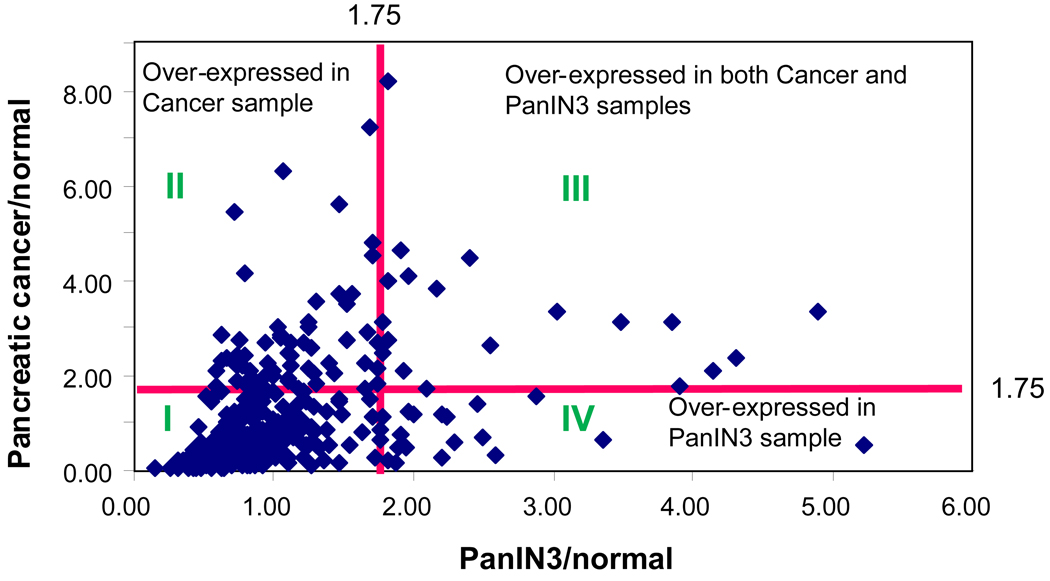
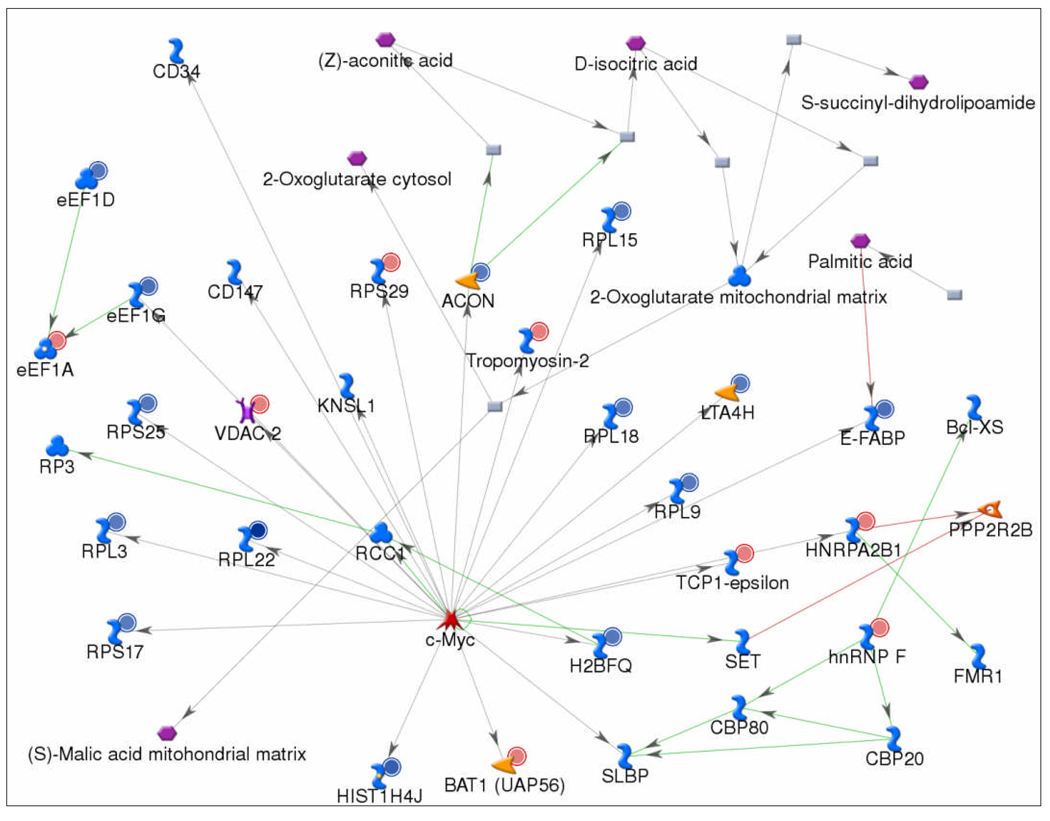
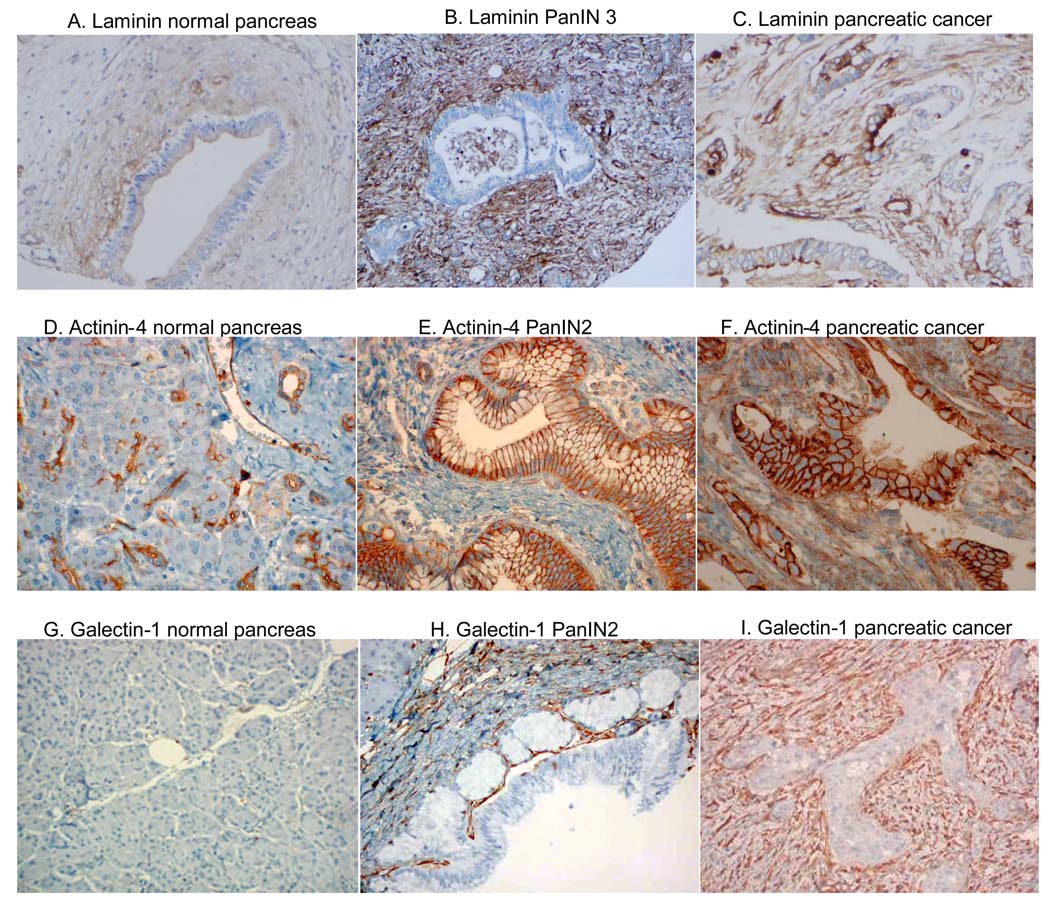
Patients with pancreatic cancer are usually diagnosed at late stages, when the disease is incurable. Pancreatic intraepithelial neoplasia (PanIN) 3 is believed to be the immediate precursor lesion of pancreatic adenocarcinoma, and would be an ideal stage to diagnose patients, when intervention and cure are possible and patients are curable. In this study, we used quantitative proteomics to identify dysregulated proteins in PanIN 3 lesions. Altogether, over 200 dysregulated proteins were identified in the PanIN 3 tissues, with a minimum of a 1.75-fold change compared with the proteins in normal pancreas. These dysregulated PanIN 3 proteins play roles in cell motility, the inflammatory response, the blood clotting cascade, the cell cycle and its regulation, and protein degradation. Further network analysis of the proteins identified c-MYC as an important regulatory protein in PanIN 3 lesions. Finally, three of the overexpressed proteins, laminin beta-1, galectin-1, and actinin-4 were validated by immunohistochemistry analysis. All three of these proteins were overexpressed in the stroma or ductal epithelial cells of advanced PanIN lesions as well as in pancreatic cancer tissue. Our findings suggest that these three proteins may be useful as biomarkers for advanced PanIN and pancreatic cancer if further validated. The dysregulated proteins identified in this study may assist in the selection of candidates for future development of biomarkers for detecting early and curable pancreatic neoplasia.
Figures
References
-
- Jemal A, Thomas A, Murray T, Thun M. CA Cancer J.Clin. 2002;52:23–47. - PubMed
-
- Jemal A, Siegel R, Ward E, Murray T, Xu J, Smigal C, Thun MJ. CA Cancer J.Clin. 2006;56:106–130. - PubMed
-
- Kern S, Hruban R, Hollingsworth MA, Brand R, Adrian TE, Jaffee E, Tempero MA. Cancer Res. 2001;61:4923–4932. - PubMed
-
- Brand R. Cancer J. 2001;7:287–297. - PubMed
-
- Ariyama J, Suyama M, Satoh K, Sai J. Pancreas. 1998;16:396–401. - PubMed
Publication types
MeSH terms
Substances
Grants and funding
LinkOut - more resources
Full Text Sources
Other Literature Sources
Medical
Research Materials
