. 2009 Sep;220(3):600-10.
doi: 10.1002/jcp.21773.

Modulation of HSP27 alters hypoxia-induced endothelial permeability and related signaling pathways

Affiliations

Modulation of HSP27 alters hypoxia-induced endothelial permeability and related signaling pathways

Tiegang Liu et al. J Cell Physiol. 2009 Sep.

Abstract

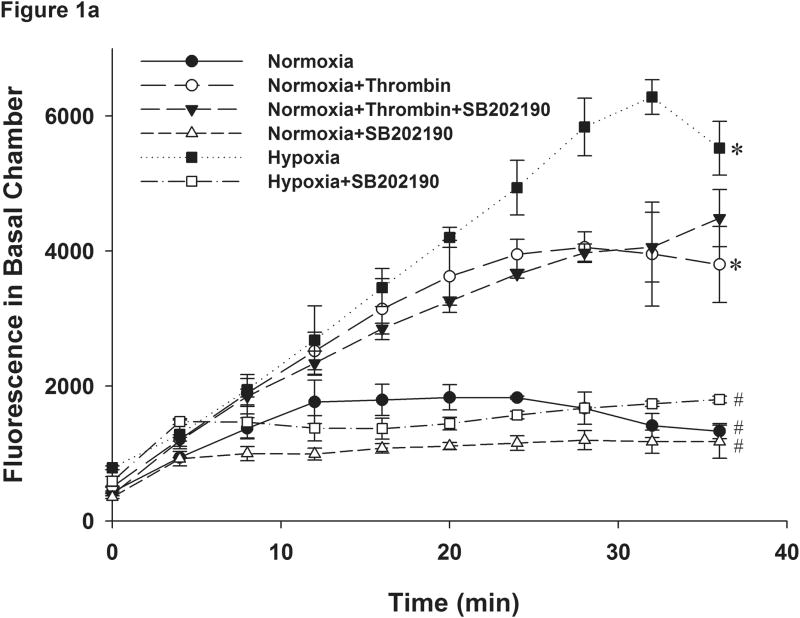
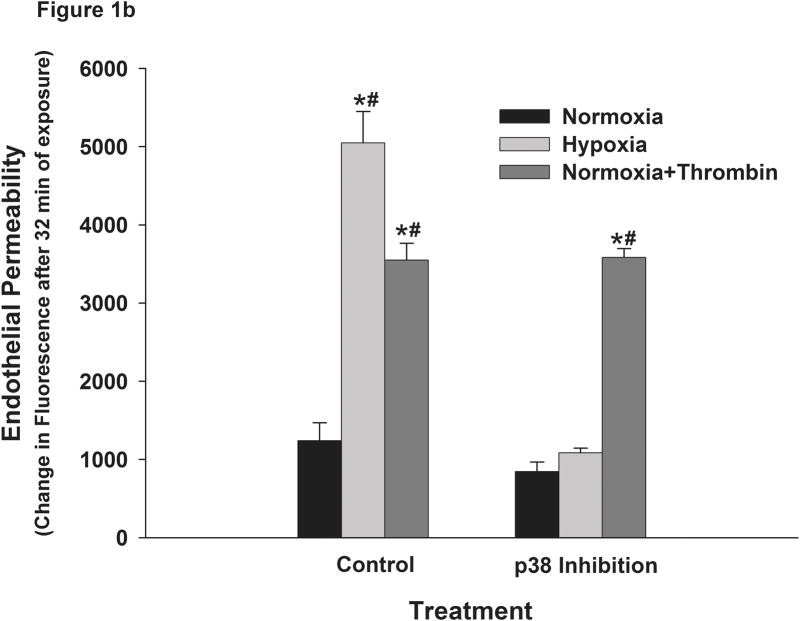
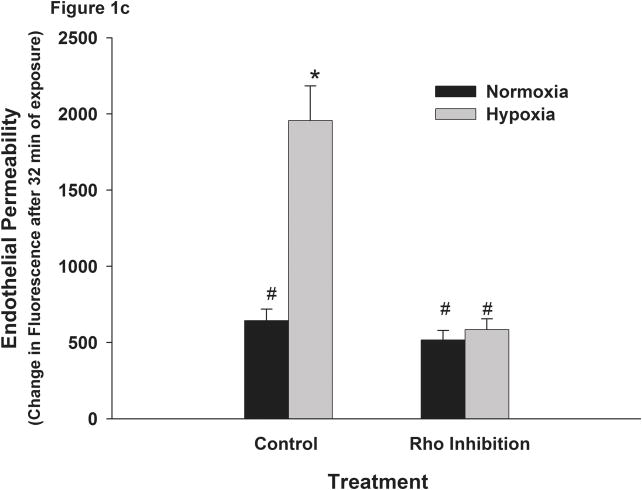
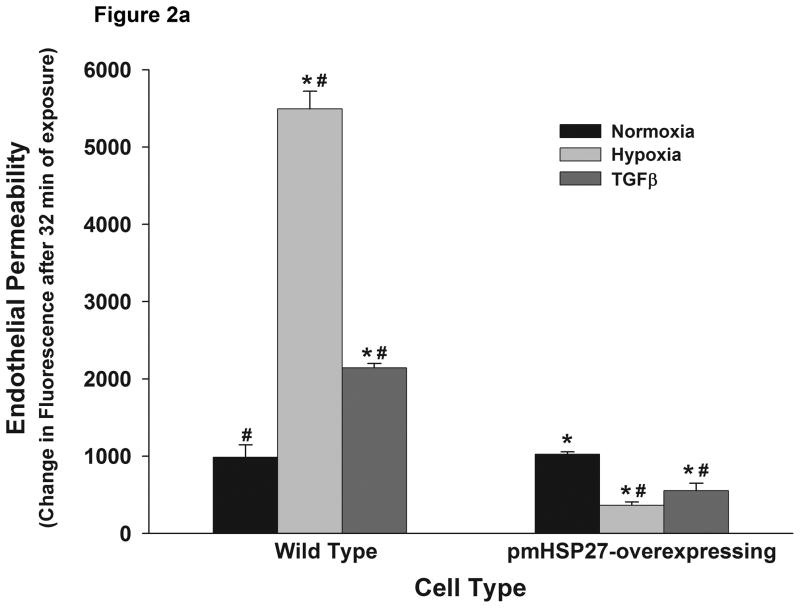
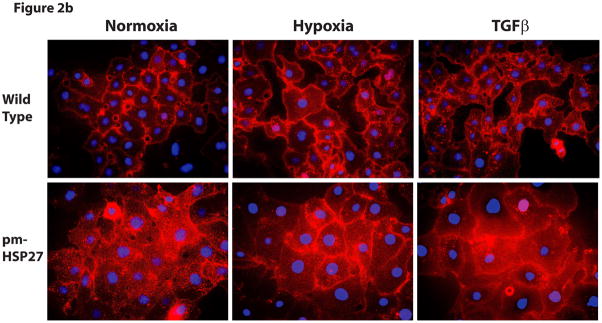
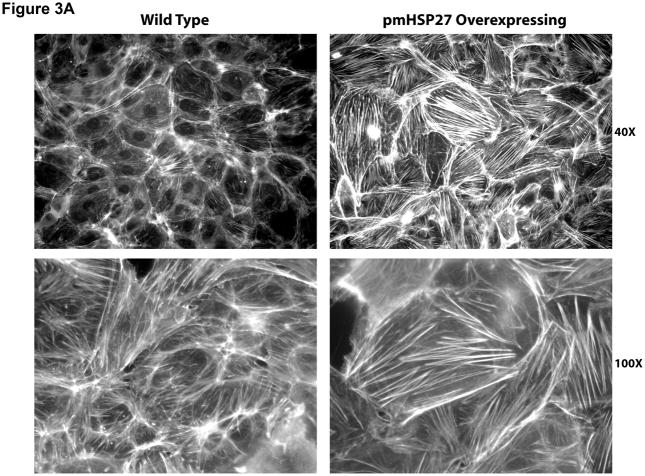
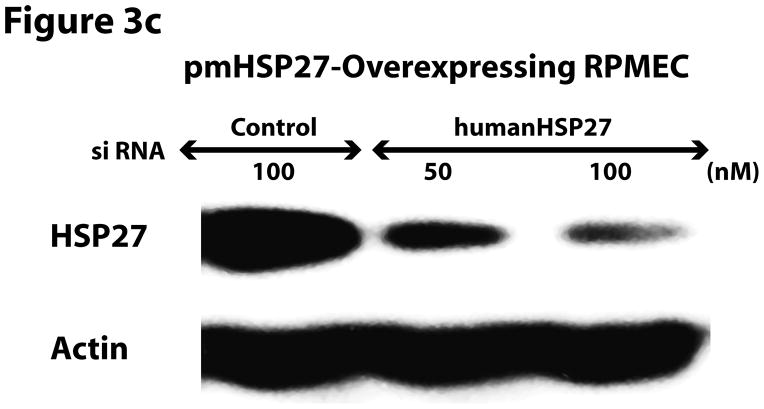
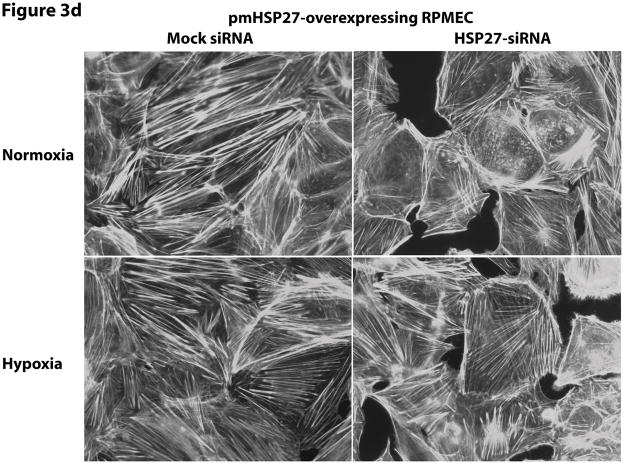
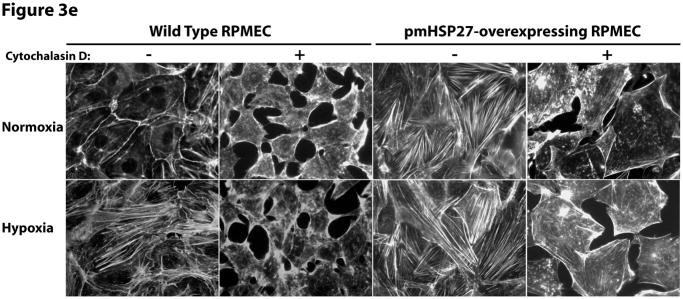
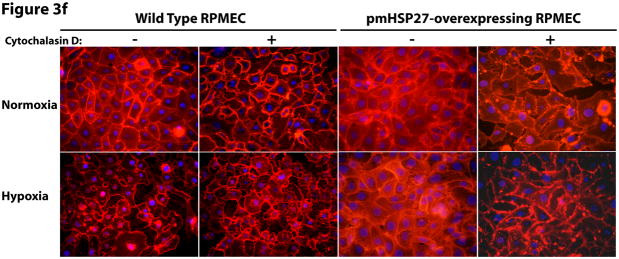
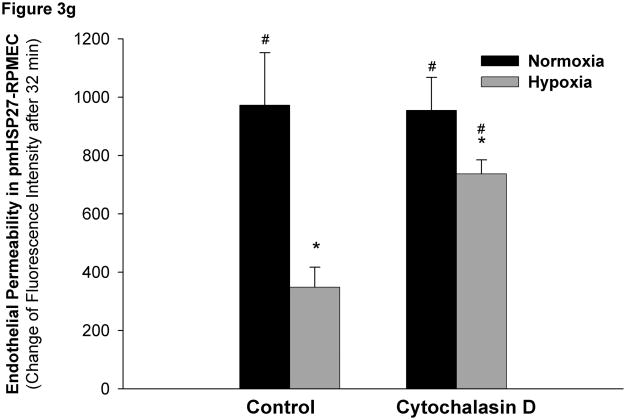
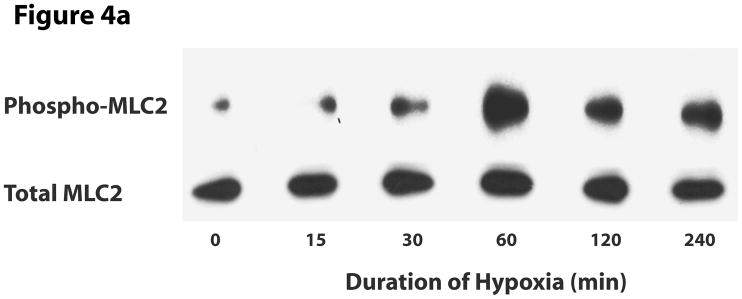
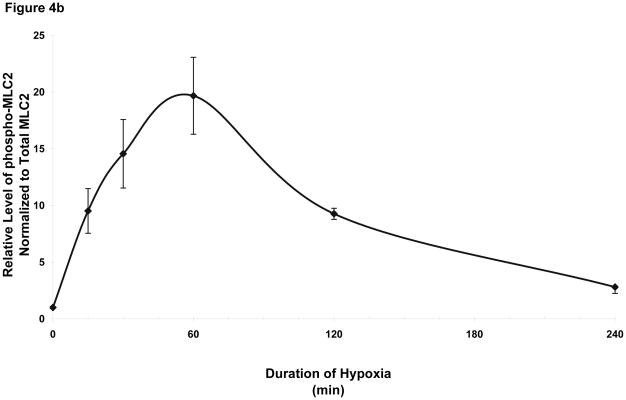
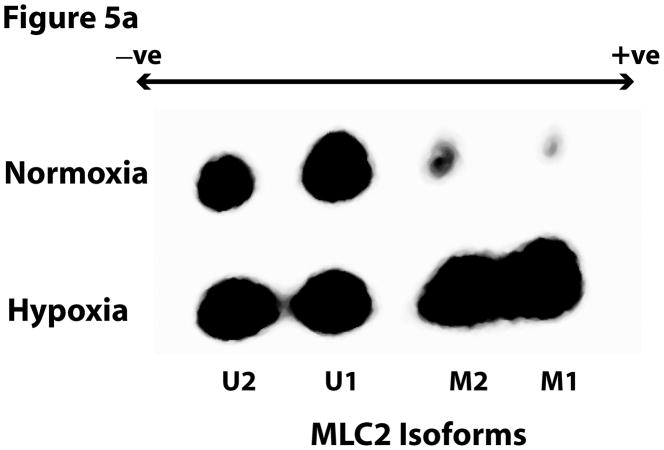
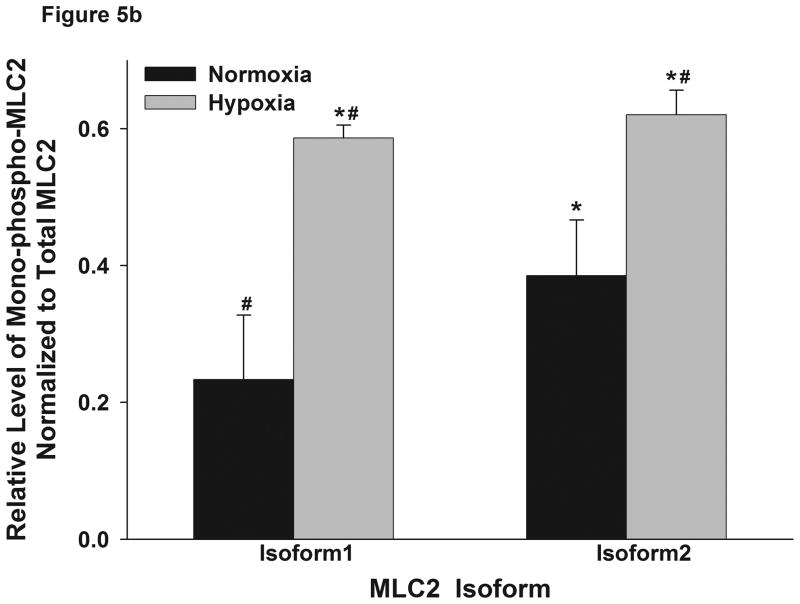
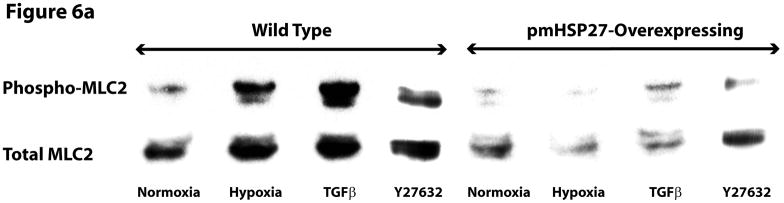
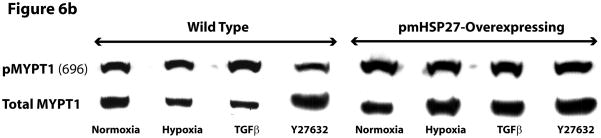
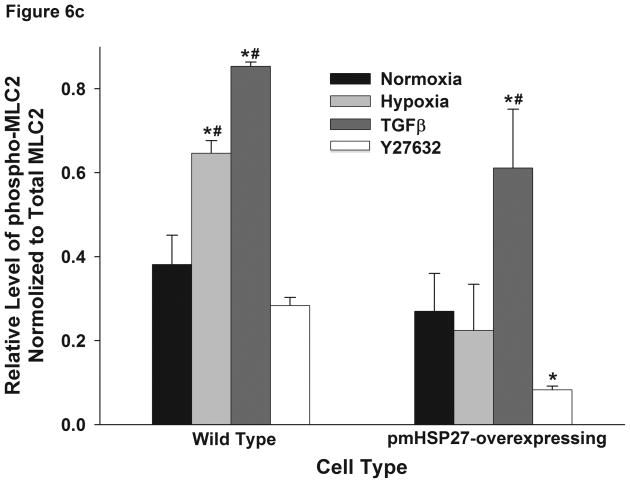
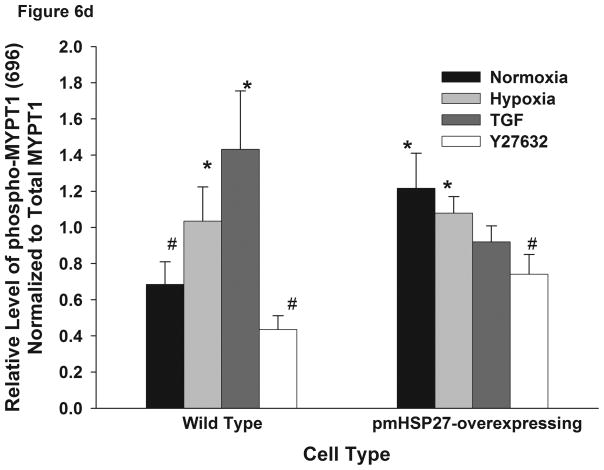
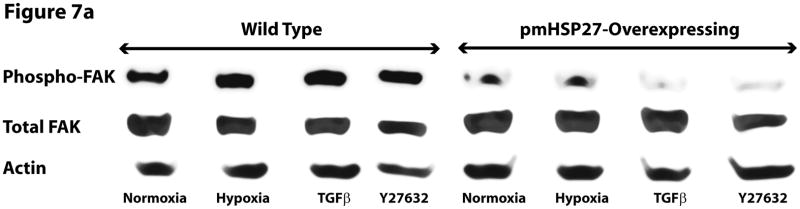
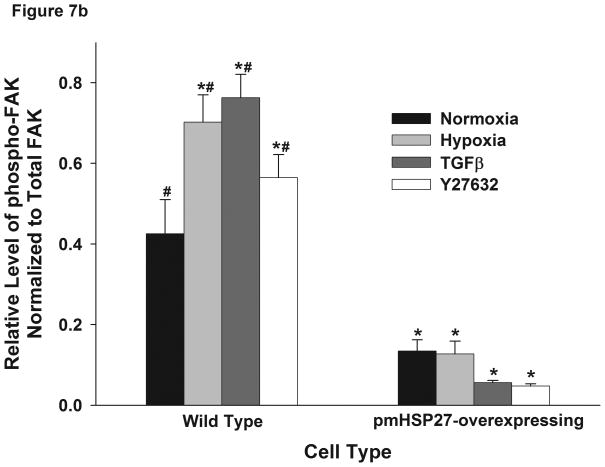
This manuscript describes how the permeability of pulmonary artery microvascular endothelial cell (RPMEC) monolayer is elevated by hypoxia and the role played by HSP27 phosphorylation. p38 MAP kinase activation leading to HSP27 phosphorylation was previously shown by our laboratory to alter the actin cytoskeleton and tethering properties of RPMEC. This effect was independent of hypoxia-induced contractility which was ROCK-dependent rather than HSP27-dependent. Results described here show that increased HSP27 phosphorylation not only does not underlie hypoxia-induced permeability, but may actually augment the endothelial barrier. Hypoxia causes gap formation between RPMEC and increases MLC2 phosphorylation. The phosphorylation of MYPT1, which inhibits MLC2 phosphatase, is also increased in hypoxia. In addition, FAK phosphorylation, which alters focal adhesion signaling, is increased in hypoxia. Overexpressing phosphomimicking HSP27 (pmHSP27), which induces significant actin stress fiber formation, surprisingly renders RPMEC resistant to hypoxia- or TGFbeta-induced permeability. siRNA against pmHSP27 reverses the increased actin stress fiber formation in pmHSP27-overexpressing cells, and disrupting actin stress fibers in pmHSP27-overexpressing RPMEC renders them more susceptible to hypoxia. Finally, hypoxia-induced gap formation, as well as phosphorylation of MLC2, MYPT1 and FAK are almost abolished by overexpressing pmHSP27 in RPMEC. These effects of pmHSP27 overexpression might represent decreased cytoskeletal plasticity and increased tethering which counteracts permeability-inducing contractility. Thus hypoxia activates two pathways one leading to contractility and increased permeability, the other leading to actin stress fibers, stronger adhesion, and reduced permeability. Altering HSP27 phosphorylation, which tips the balance towards decreased permeability, might be targeted in managing endothelial barrier dysfunction.


Figures

Figure 1
Figure 1
Monolayer permeability of RPMEC was increased by exposure to hypoxia. RPMEC monolayers were grown on filter inserts and exposed to normoxia, hypoxia (3% O2) or Thrombin (1U/ml). The transfer of Alexa Fluor-dextran (3 kDa) through the monolayer was measured over time. (a) Hypoxia and thrombin increased the amount of Alexa Fluor-dextran in the basolateral chamber at a higher rate than normoxia. An inhibitor of p38 (SB202190, 1 μM) reduced the fluorescence transfer in response to hypoxia. Data are presented as means ± standard deviation (n =4 samples). (b) Represents the change in fluorescence after 32 minutes of exposure. (c) Inhibition of ROCK abolished hypoxia-induced permeability in RPMEC. * Statistically significant difference from normoxia control mean, # statistically significant difference from normoxia with p38 inhibition mean. P <0.05 in ANOVA and Holm-Sidak post hoc analysis.
Figure 1
Figure 1
Monolayer permeability of RPMEC was increased by exposure to hypoxia. RPMEC monolayers were grown on filter inserts and exposed to normoxia, hypoxia (3% O2) or Thrombin (1U/ml). The transfer of Alexa Fluor-dextran (3 kDa) through the monolayer was measured over time. (a) Hypoxia and thrombin increased the amount of Alexa Fluor-dextran in the basolateral chamber at a higher rate than normoxia. An inhibitor of p38 (SB202190, 1 μM) reduced the fluorescence transfer in response to hypoxia. Data are presented as means ± standard deviation (n =4 samples). (b) Represents the change in fluorescence after 32 minutes of exposure. (c) Inhibition of ROCK abolished hypoxia-induced permeability in RPMEC. * Statistically significant difference from normoxia control mean, # statistically significant difference from normoxia with p38 inhibition mean. P <0.05 in ANOVA and Holm-Sidak post hoc analysis.
Figure 2
Figure 2
Overexpression of pmHSP27 abolished the increased permeability and gap formation induced by hypoxia or TGFβ in RPMEC monolayer. (a) RPMEC were stably transfected with a plasmid carrying phosphomimicking mutant pmHSP27 sequence. These cells were then exposed to hypoxia or TGFβ (1 ng/mL) for the duration shown. Overexposing pmHSP27 reversed the response of RPMEC to hypoxia or TGFβ. Data are presented as means ± standard deviation (n =4 samples). * Statistically significant difference from normoxia wild type mean, # statistically significant difference from normoxia pmHSP27-overexpressing mean. P <0.05 in ANOVA and Holm-Sidak post hoc analysis. (b) The borders between endothelial cells were visualized by staining plasma membranes and nuclei after treatment with 3% oxygen for 1 h or TGFβ (1 ng/mL) for 15 min. Both hypoxia and TGFβ increased the number and size of gaps forming between RPMEC, and overexpression of pmHSP27 reversed the increased intercellular gaps induced by hypoxia or TGFβ.
Figure 2
Figure 2
Overexpression of pmHSP27 abolished the increased permeability and gap formation induced by hypoxia or TGFβ in RPMEC monolayer. (a) RPMEC were stably transfected with a plasmid carrying phosphomimicking mutant pmHSP27 sequence. These cells were then exposed to hypoxia or TGFβ (1 ng/mL) for the duration shown. Overexposing pmHSP27 reversed the response of RPMEC to hypoxia or TGFβ. Data are presented as means ± standard deviation (n =4 samples). * Statistically significant difference from normoxia wild type mean, # statistically significant difference from normoxia pmHSP27-overexpressing mean. P <0.05 in ANOVA and Holm-Sidak post hoc analysis. (b) The borders between endothelial cells were visualized by staining plasma membranes and nuclei after treatment with 3% oxygen for 1 h or TGFβ (1 ng/mL) for 15 min. Both hypoxia and TGFβ increased the number and size of gaps forming between RPMEC, and overexpression of pmHSP27 reversed the increased intercellular gaps induced by hypoxia or TGFβ.
Figure 3
Figure 3
HSP27, actin stress fibers, and endothelial barrier integrity. (a) Over-expression of pmHSP27 increased the formation of actin stress fiber in PRMEC. pmHSP27-overexpressing RPMECs grown on coverslips were stained with Rhodamine-phalloidin for 20 min, actin stress fibers was visualized with fluorescence microscopy. (b) Human HSP27 siRNA did not affect the expression level of endogenous rat HSP27. Wild type RPMEC was transfected with human HSP27 siRNA and mock control siRNA, then protein level of HSP27 was assayed after 36 h by Western blotting. (c) Human HSP27 siRNA reduced the expression of pmHSP27 in pmHSP27-overexpressing RPMEC. Transfection was performed at the indicated concentrations of siRNA, then expression level of pmHSP27 was tested after 36 h by Western blotting. (d) Transfection of pmHSP27 siRNA attenuated the formation of actin stress fiber in pmHSP27-overexpressing RPMEC. After transfection of pmHSP27 siRNA, actin stress fibers were visualized in pmHSP27-overexpressing RPMEC grown on cover slips by Rhodamine-phalloidin staining. Magnification was 400X. (e) Cytochalasin D inhibited the formation of actin stress fiber. Stress fibers were visualized by Rhodamine-phalloidin staining after treatment with an inhibitor of actin filament formation, Cytochalasin D (2 μM) Magnification was 400X. (f) Cytochalasin D inhibited the formation of intercellular gaps. Gaps between cells were visualized with Image-iT LIVE Plasma Membrane and Nuclear Labeling Kit. Magnification was 400X. (g) Cytochalasin D reversed the reduced permeability in pmHSP27-overexpressing RPMEC. Permeability was tested after 32 min treatment with Cytochalasin D. Data are presented as means ± standard deviation (n =4 samples). * Statistically significant difference from normoxic control mean, # statistically significant difference from hypoxic control mean. P <0.05 in ANOVA and Holm-Sidak post hoc analysis.
Figure 3
Figure 3
HSP27, actin stress fibers, and endothelial barrier integrity. (a) Over-expression of pmHSP27 increased the formation of actin stress fiber in PRMEC. pmHSP27-overexpressing RPMECs grown on coverslips were stained with Rhodamine-phalloidin for 20 min, actin stress fibers was visualized with fluorescence microscopy. (b) Human HSP27 siRNA did not affect the expression level of endogenous rat HSP27. Wild type RPMEC was transfected with human HSP27 siRNA and mock control siRNA, then protein level of HSP27 was assayed after 36 h by Western blotting. (c) Human HSP27 siRNA reduced the expression of pmHSP27 in pmHSP27-overexpressing RPMEC. Transfection was performed at the indicated concentrations of siRNA, then expression level of pmHSP27 was tested after 36 h by Western blotting. (d) Transfection of pmHSP27 siRNA attenuated the formation of actin stress fiber in pmHSP27-overexpressing RPMEC. After transfection of pmHSP27 siRNA, actin stress fibers were visualized in pmHSP27-overexpressing RPMEC grown on cover slips by Rhodamine-phalloidin staining. Magnification was 400X. (e) Cytochalasin D inhibited the formation of actin stress fiber. Stress fibers were visualized by Rhodamine-phalloidin staining after treatment with an inhibitor of actin filament formation, Cytochalasin D (2 μM) Magnification was 400X. (f) Cytochalasin D inhibited the formation of intercellular gaps. Gaps between cells were visualized with Image-iT LIVE Plasma Membrane and Nuclear Labeling Kit. Magnification was 400X. (g) Cytochalasin D reversed the reduced permeability in pmHSP27-overexpressing RPMEC. Permeability was tested after 32 min treatment with Cytochalasin D. Data are presented as means ± standard deviation (n =4 samples). * Statistically significant difference from normoxic control mean, # statistically significant difference from hypoxic control mean. P <0.05 in ANOVA and Holm-Sidak post hoc analysis.
Figure 4
Figure 4
Increased phosphorylation of MLC2 in hypoxia. RPMEC were treated with hypoxia for different times, then proteins were precipitated with 5% TCA. (a) The samples were run on SDS-PAGE gel. The target protein was detected with antibodies against phospho-MLC2 and total MLC2. The picture is representative of three different experiments. (b) Time-course of altered MLC2 phosphorylation in hypoxia. The intensity of every band of phospho-MLC2 protein was normalized to that of corresponding total MLC2. The data represent average ± standard deviation of three different experiments.
Figure 4
Figure 4
Increased phosphorylation of MLC2 in hypoxia. RPMEC were treated with hypoxia for different times, then proteins were precipitated with 5% TCA. (a) The samples were run on SDS-PAGE gel. The target protein was detected with antibodies against phospho-MLC2 and total MLC2. The picture is representative of three different experiments. (b) Time-course of altered MLC2 phosphorylation in hypoxia. The intensity of every band of phospho-MLC2 protein was normalized to that of corresponding total MLC2. The data represent average ± standard deviation of three different experiments.
Figure 5
Figure 5
Hypoxia increased the phosphorylation level of different isoforms of MLC2. (a) RPMEC were exposed to hypoxia for 1 hour, cell lysates were subjected to 2-D electrophoresis, and immunoblotted with anti-total MLC2 antibody. Phosphorylation causes MLC2 to become more acidic. Two isoforms of MLC2 were observed (1 and 2), and only monophosphorylated forms were found to be increased with hypoxia (M1 and M2 = monophosphorylated isoforms 1 and 2; U1 and U2 = unphosphorylated isoforms 1 and 2). No changes in diphosphorylated MLC2 were observed by 2-D electrophoresis. (b) For each isofrom the intensity of the monophospho-protein spot was normalized to that of total protein of corresponding isoform. The data represent average ± standard deviation of three different experiments. * Statistically significant difference from normoxia isoform 1 mean, # statistically significant difference from normoxia isoform 2 mean. P <0.05 in ANOVA and Holm-Sidak post hoc analysis.
Figure 5
Figure 5
Hypoxia increased the phosphorylation level of different isoforms of MLC2. (a) RPMEC were exposed to hypoxia for 1 hour, cell lysates were subjected to 2-D electrophoresis, and immunoblotted with anti-total MLC2 antibody. Phosphorylation causes MLC2 to become more acidic. Two isoforms of MLC2 were observed (1 and 2), and only monophosphorylated forms were found to be increased with hypoxia (M1 and M2 = monophosphorylated isoforms 1 and 2; U1 and U2 = unphosphorylated isoforms 1 and 2). No changes in diphosphorylated MLC2 were observed by 2-D electrophoresis. (b) For each isofrom the intensity of the monophospho-protein spot was normalized to that of total protein of corresponding isoform. The data represent average ± standard deviation of three different experiments. * Statistically significant difference from normoxia isoform 1 mean, # statistically significant difference from normoxia isoform 2 mean. P <0.05 in ANOVA and Holm-Sidak post hoc analysis.
Figure 6
Figure 6
Over-expression of pmHSP27 attenuates MLC2 and MYPT1 phosphorylation. RPMEC and pmHSP27-overexpressing RPMEC were exposed to hypoxia (3%) for 1 h or TGFβ (1 ng/ml) for 10 min. Cell lysates were then immunoblotted to test the phosphorylation of MLC2 (a) and MYPT1 (b). The bar graph shows quantitation of the intensity of bands of phospho-MLC2 (c) and phospho-MYPT1-696 (d) normalized to corresponding total protein. While hypoxia and TGFβ increased the phosphorylation of MLC2 and MYPT1 in wild type RPMEC, they did not induce these effects in pmHSP27 overexpressing RPMEC. Inhibiting Rho kinase with Y27632 (2μM) also inhibited MLC2 and MYPT1 phosphorylation in response to hypoxia. The data represent average ± standard deviation of three different experiments. * Statistically significant difference from normoxia wild type mean, # statistically significant difference from normoxia pmHSP27-overexpressing mean. P <0.05 in ANOVA and Holm-Sidak post hoc analysis.
Figure 6
Figure 6
Over-expression of pmHSP27 attenuates MLC2 and MYPT1 phosphorylation. RPMEC and pmHSP27-overexpressing RPMEC were exposed to hypoxia (3%) for 1 h or TGFβ (1 ng/ml) for 10 min. Cell lysates were then immunoblotted to test the phosphorylation of MLC2 (a) and MYPT1 (b). The bar graph shows quantitation of the intensity of bands of phospho-MLC2 (c) and phospho-MYPT1-696 (d) normalized to corresponding total protein. While hypoxia and TGFβ increased the phosphorylation of MLC2 and MYPT1 in wild type RPMEC, they did not induce these effects in pmHSP27 overexpressing RPMEC. Inhibiting Rho kinase with Y27632 (2μM) also inhibited MLC2 and MYPT1 phosphorylation in response to hypoxia. The data represent average ± standard deviation of three different experiments. * Statistically significant difference from normoxia wild type mean, # statistically significant difference from normoxia pmHSP27-overexpressing mean. P <0.05 in ANOVA and Holm-Sidak post hoc analysis.
Figure 7
Figure 7
Hypoxia increased the phosphorylation level of FAK in wild type but not pmHSP27-overexpressing RPMEC. Wild type RPMEC and pmHSP27-RPMEC were exposed to hypoxia (3%) for 1 h or TGFβ (1ng/ml) for 10 min, then (a) Western blotting was performed to test the phosphorylation of FAK. (b) The bar graph shows quantitation of the intensity of phospho-MLC2 bands normalized to that of total FAK. The data represent average ± standard deviation of three different experiments. * Statistically significant difference from normoxia wild type mean, # statistically significant difference from normoxia pmHSP27-overexpressing mean. P <0.05 in ANOVA and Holm-Sidak post hoc analysis.
Figure 7
Figure 7
Hypoxia increased the phosphorylation level of FAK in wild type but not pmHSP27-overexpressing RPMEC. Wild type RPMEC and pmHSP27-RPMEC were exposed to hypoxia (3%) for 1 h or TGFβ (1ng/ml) for 10 min, then (a) Western blotting was performed to test the phosphorylation of FAK. (b) The bar graph shows quantitation of the intensity of phospho-MLC2 bands normalized to that of total FAK. The data represent average ± standard deviation of three different experiments. * Statistically significant difference from normoxia wild type mean, # statistically significant difference from normoxia pmHSP27-overexpressing mean. P <0.05 in ANOVA and Holm-Sidak post hoc analysis.

References

    1. Akiyama K, Akopian G, Jinadasa P, Gluckman TL, Terhakopian A, Massey B, Bing RJ. Myocardial infarction and regulatory myosin light chain. J Mol Cell Cardiol. 1997;29(10):2641–2652. - PubMed
    1. Ali MH, Schlidt SA, Chandel NS, Hynes KL, Schumacker PT, Gewertz BL. Endothelial permeability and IL-6 production during hypoxia: role of ROS in signal transduction. Am J Physiol. 1999;277(5 Pt 1):L1057–1065. - PubMed
    1. Amano M, Ito M, Kimura K, Fukata Y, Chihara K, Nakano T, Matsuura Y, Kaibuchi K. Phosphorylation and activation of myosin by Rho-associated kinase (Rho-kinase) J Biol Chem. 1996;271(34):20246–20249. - PubMed
    1. An SS, Pennella CM, Gonnabathula A, Chen J, Wang N, Gaestel M, Hassoun PM, Fredberg JJ, Kayyali US. Hypoxia alters biophysical properties of endothelial cells via p38 MAPK- and Rho kinase-dependent pathways. Am J Physiol Cell Physiol. 2005;289(3):C521–530. - PubMed
    1. Baudry N, Danialou G, Boczkowski J, Vicaut E. In vivo study of the effect of systemic hypoxia on leukocyte-endothelium interactions. Am J Respir Crit Care Med. 1998;158(2):477–483. - PubMed

Publication types

MeSH terms