. 2009 Jun;75(6):510-9.
doi: 10.1002/cyto.a.20727.

Induction of DNA damage response by the supravital probes of nucleic acids

Affiliations

Induction of DNA damage response by the supravital probes of nucleic acids

Hong Zhao et al. Cytometry A. 2009 Jun.

Abstract

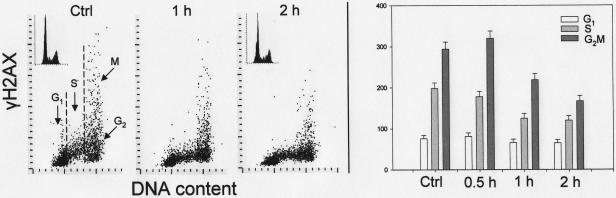
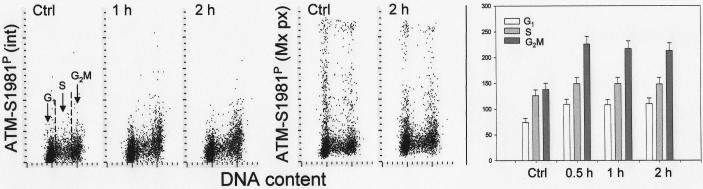
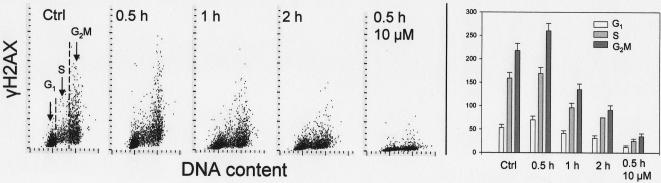
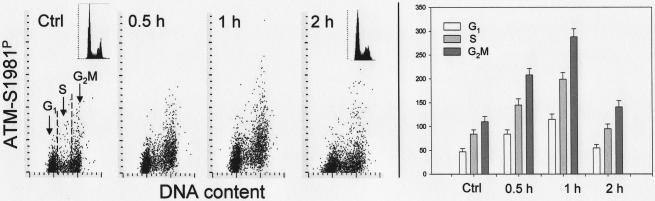
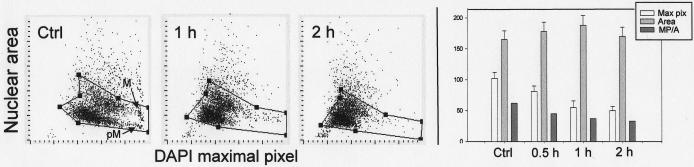
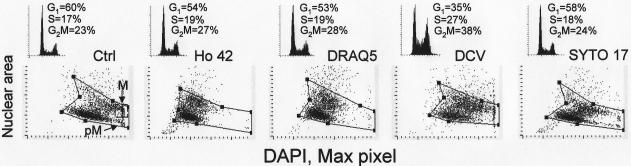
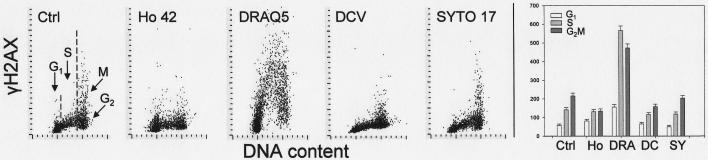
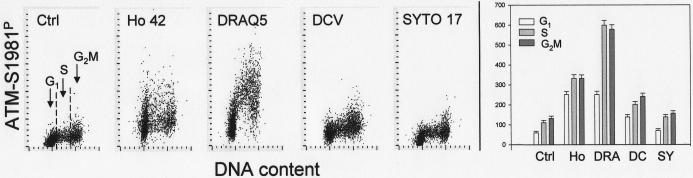
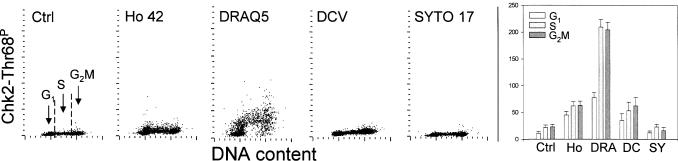
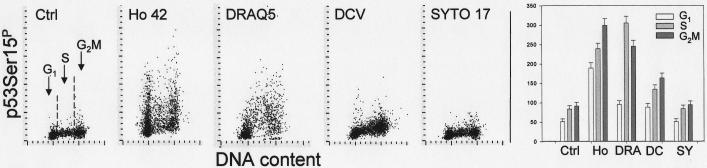
The aim of this study was to assess the potential DNA damage response (DDR) to four supravitally used biomarkers Hoechst 33342 (Ho 42), DRAQ5, DyeCycle Violet (DCV), and SYTO 17. A549 cells were exposed to these biomarkers at concentrations generally applied to live cells and their effect on histone H2AX (Ser 139), p53 (Ser15), ATM (Ser1981), and Chk2 (Thr68) phosphorylation was assessed using phospho-specific Abs. Short-term treatment with Ho 42 led to modest degree of ATM activation with no evidence of H2AX, Chk2, or p53 phosphorylation. However, pronounced ATM, Chk2, and p53 phosphorylation and perturbed G(2) progression were seen after 18 h. While short-term treatment with DRAQ5 induced ATM activation with no effect on H2AX, Chk2, and p53, dramatic changes marked by a high degree of H2AX, ATM, Chk2, and p53 phosphorylation, all occurring predominantly in S phase cells, and a block in cell cycle progression, were seen after 18 h exposure. These changes suggest that the DRAQ5-induced DNA lesions may become converted into double-strand DNA breaks during replication. Exposure to DCV also led to an increase in the level of activated ATM and Chk2 as well as of phosphorylated p53 and accumulation of cells in G(2)M and S phase. Exposure to SYTO 17 had no significant effect on any of the measured parameters. The data indicate that supravital use of Ho 42, DRAQ5, and DCV induces various degrees of DDR, including activation of ATM, Chk2 and p53, which may have significant consequences on regulatory cell cycle pathways and apoptosis.


Figures

Fig. 1
Fig. 1
Changes in expression of γH2AX in A549 cells treated with Ho 42 in relation to the cell cycle phase. The bivariate distributions (scatterplots) shown in left panels illustrate expression of γH2AX in untreated cells (Ctrl) or the cells exposed to Ho 42 at 0.1 μM concentration for 1 or 2 h in relation to cellular DNA content. DNA content histograms of the untreated and 2 h treated cells as presented in the insets. Based on differences in DNA content cells in G1, S and G2M phases of the cell cycle were gated (as shown) and mean values of γH2AX IF (+SD) of these cell populations are presented in the form of bar graphs (right panel).
Fig. 2
Fig. 2
Changes in expression of ATM-S1981P in A549 cells treated with Ho 42 in relation to the cell cycle phase. The bivariate distributions reveal expression of ATM-S1981P recorded either as integrated value (int) or maximal pixel (Mx px) with respect to DNA content in untreated cells (Ctrl) or the cells exposed to Ho 42 at 0.1 μM concentration for 1 or 2 h in relation to cellular DNA content. Based on differences in DNA content cells in G1, S and G2M phases of the cell cycle were gated (as shown) and mean values of γH2AX IF (+SD) of these cell populations are presented in the form of bar graphs (right panel).
Fig. 3
Fig. 3
Changes in expression of γH2AX in A549 cells treated with DRAQ5 in relation to the cell cycle phase. The bivariate distributions shown in left panels illustrate expression of γH2AX in the cells exposed to DRAQ5 at 2 μM concentration for 30 min, 1 or 2 h or to 10μM DRAQ5 for 30 min versus DNA content. The DNA content histograms of the untreated and 2 h-treated cells are shown in the respective insets. Based on differences in DNA content cells in G1, S and G2M phases of the cell cycle were gated as shown and mean values of γH2AX IF (+SD) of these cell populations are presented as bar graphs (right panel).
Fig. 4
Fig. 4
Changes in expression of ATM phosphorylated on Ser1981 in A549 cells treated with DRAQ5 in relation to the cell cycle phase. The bivariate distributions show expression of ATM-S1981P in the cells exposed to 2 μM DRAQ5 for 30 min, 1 h and 2 h with respect to their DNA content. The DNA content histograms of the untreated and 2 h-treated cells are shown in the respective insets. The bar graph illustrates the mean values of ATM-S1981P immunofluorescence of cells in relation at different phases of the cell cycle.
Fig. 5
Fig. 5
Effect of DRAQ5 on chromatin structure of A549 cells. The cells were untreated (Ctrl) or treated with DRAQ5 at 2 μM concentration for 1 or 2 h, then fixed. The bivariate distributions (left panels) show the nuclear area (contoured on DAPI fluorescence) plotted against the maximal pixel intensity of DAPI fluorescence. The right panel shows bar graphs representing in mean values (+SD) of maximal pixel (Max pix), nuclear area (Area) and of ratio of maximal pixel to nuclear area (MP/Area) of all cells, untreated and treated with DRAQ5. To exclude doublets and debris the cells were gated as shown in individual panels by solid lines. The cells characterized by high intensity maximal pixel (in Ctrl) are either mitotic (M) or post-mitotic (pM), identified by their imaging. The decline in intensity of maximal pixel fluorescence of the DNA-associated fluorescence such as DAPI concurrent with some increase in nuclear area, as seen in DRAQ5 treated cells, is a characteristic feature of chromatin decondensation.
Fig. 6
Fig. 6
Cell cycle distribution and chromatin status (nuclear area vs maximal pixel of DAPI fluorescence) of A549 cells exposed in cultures to Ho 42 (1 μM), DRAQ5 (2 μM), DCV (5 μM) or SYTO 17 (50 nM) for 18 h.
Fig. 7
Fig. 7
Effect of exposure of A549 cells to the studied probes for 18 h on H2AX phosphorylation. The bivariate (DNA content vs γH2AX IF) distributions of the untreated cells (Ctrl) and the cells treated in cultures with 1 μM Ho 42, 2 μM DRAQ5, 5 μM DCV and 50 nM SYTO 17 for 18 h. Subpopulations of G1, S and G2M cells were gated based on differences in cellular DNA content and their mean values of γH2AX IF (+SD) are presented as bar graphs (right panel).
Fig. 8
Fig. 8
Effect of treatment of A549 cells with the studied probes for 18 h on phosphorylation of ATM on Ser 1981. The bivariate (DNA content vs ATM-S1981P) distributions of the untreated cells (Ctrl) and the cells treated in cultures with 1 μM Ho 42, 2 μM DRAQ5, 5 μM DCV and 50 nM SYTO 17 for 18 h. The mean values of ATM-S1981P (+SD) of G1, S and G2M cells are presented as bar graphs (right panel; Ho-Hoechst 33342; DRA-DRAQ5; DC-DCV; SY-SYTO 17).
Fig. 9
Fig. 9
Effect of treatment of A549 cells with the studied probes for 18 h on Chk2 phosphorylation on Thr68. The bivariate (DNA content vs Chk2-Thr68P) distributions of the untreated cells (Ctrl) and the cells treated in cultures with 1 μM Ho 42, 2 μM DRAQ5, 5 μM DCV and 50 nM SYTO 17 for 18 h. The mean values of Chk2-Thr68P (+SD) of G1, S and G2M cells are presented as bar graphs (right panel: Ho-Ho 42; DRA-DRAQ5; DC-DCV; SY-SYTO 17).
Fig. 10
Fig. 10
Phosphorylation of p53 on Ser 15 in A549 cells treated with the studied probes for 18 h. The bivariate (DNA content vs p53-S15P) distributions of the untreated cells (Ctrl) and the cells treated in cultures with 1 μM Hoechst 33 42, 2 μM DRAQ5, 5 μM DCV and 50 nM SYTO 17 for 18 h. The mean values of p53-S15P (+SD) of G1, S and G2M cells are presented as bar graphs (right panel: Ho-Ho 42; DRA-DRAQ5; DC-DCV; SY-SYTO 17).

Similar articles

Cited by

References

    1. Rogakou EP, Pilch DR, Orr AH, Ivanova VS, Bonner WM. DNA double-stranded breaks induce histone H2AX phosphorylation on serine 139. J Biol Chem. 1998;273:5858–5868. - PubMed
    1. Burma S, Chen BP, Murphy M, Kurimasa A, Chen DJ. ATM phosphorylates histone H2AX in response to DNA double-strand breaks. J Biol Chem. 2001;276:42462–42467. - PubMed
    1. Lavin MF, Kozlov S. ATM activation and DNA damage response. Cell Cycle. 2007;6:931–942. - PubMed
    1. Bartkova J, Bakkenist CJ, Rajpert-De Meyts E, Skakkebaek NE, Sehested M, Lukas J, Kastan MB, Bartek J. ATM activation in normal human tissues and testicular cancer. Cell Cycle. 2005;4:838–845. - PubMed
    1. Kinner A, Wu W, Staudt C, Iliakis G. γ-H2AX in recognition and signaling of DNA double-strand breaks in the context of chromatin. Nucleic Acids Res. 2008;36:5678–5694. - PMC - PubMed

Publication types