

doi: 10.1021/nl901163k.
Nanometer distance measurements between multicolor quantum dots
Affiliations
- PMID: 19374434
- PMCID: PMC2748936
- DOI: 10.1021/nl901163k
Item in Clipboard
Nanometer distance measurements between multicolor quantum dots
Nano Lett.
2009 May.
Abstract
Quantum dot dimers made of short double-stranded DNA molecules labeled with different color quantum dots at each end were imaged using multicolor stage-scanning confocal microscopy. This approach eliminates chromatic aberration and color registration issues usually encountered in other multicolor imaging techniques. We demonstrate nanometer accuracy in individual distance measurement by suppression of quantum dot blinking and thoroughly characterize the contribution of different effects to the variability observed between measurements. Our analysis opens the way to accurate structural studies of biomolecules and biomolecular complexes using multicolor quantum labeling.
Figures
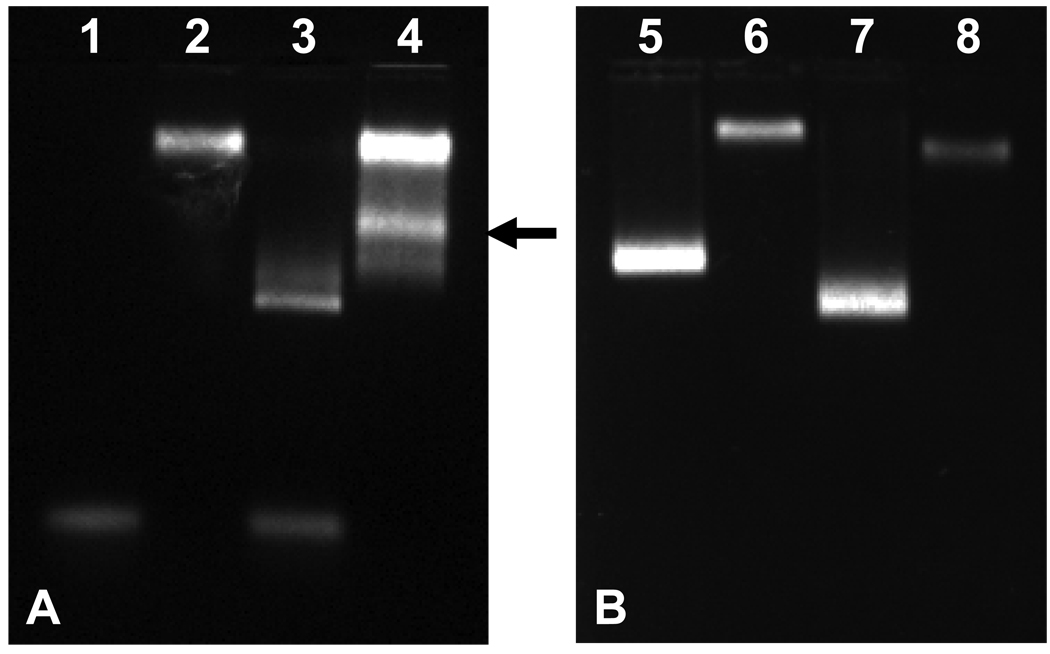
Agarose gel electrophoresis of DNA-QD dimers. A: Titration of SAV-QD585 with 90 bp 5’-biotinylated ssDNA. Lane 1: ssDNA. Lane 2: SAV-QD585. Lane 3: SAV-QD585 mixed with a 25-fold molar excess of biot-DNA, in which multiple DNA’s bind to the SAV-QD585. Lane 4: DNA mixed with an 8-fold molar excess of SAV-QD585, in which a single-DNA/single-QD conjugate is formed (arrow).B: Lane 5: single-DNA-SAV-QD585 conjugate (extracted from the band indicated in Lane 4 as described). Lane 6: SAV-QD585. Free SAV-QD585 are not visible, indicating that the DNA-QD linkage remains intact after purification. C: Lane 7: single-DNA-SAV-QD655 conjugate. Lane 8: Free SAV-QD655.
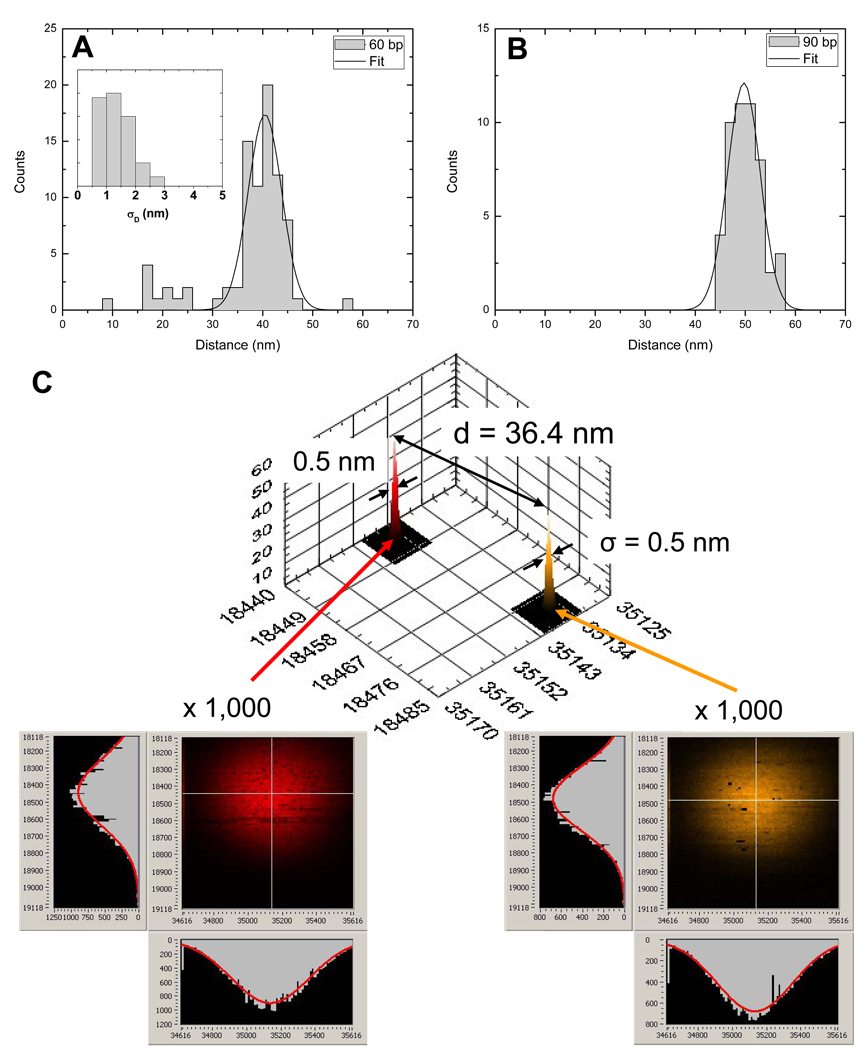
Distance histograms. A: 60 bp dimers. The Gaussian fit yields d = 40.4 ± 3.4 nm. Inset: distribution of uncertainty on the distance, as obtained from bootstrap analysis. B: 90 bp dimers. The Gaussian fit yields d = 49.7 ± 3.3 nm. C: Example of a single QD-dimer distance measurement. Top: histograms of localization of 1,000 bootstrap replicas of the SAV-QD655 image (red, left) and the SAV-QD585 image (orange, right). Each QD was localized with 0.5 nm accuracy and the measured distance was 36.4 ± 0.7 nm. Bottom: Images of each QD. The fitted center is indicated by a white cross and the fitted PSF is indicated as a red curve along the corresponding orthogonal intensity profiles.
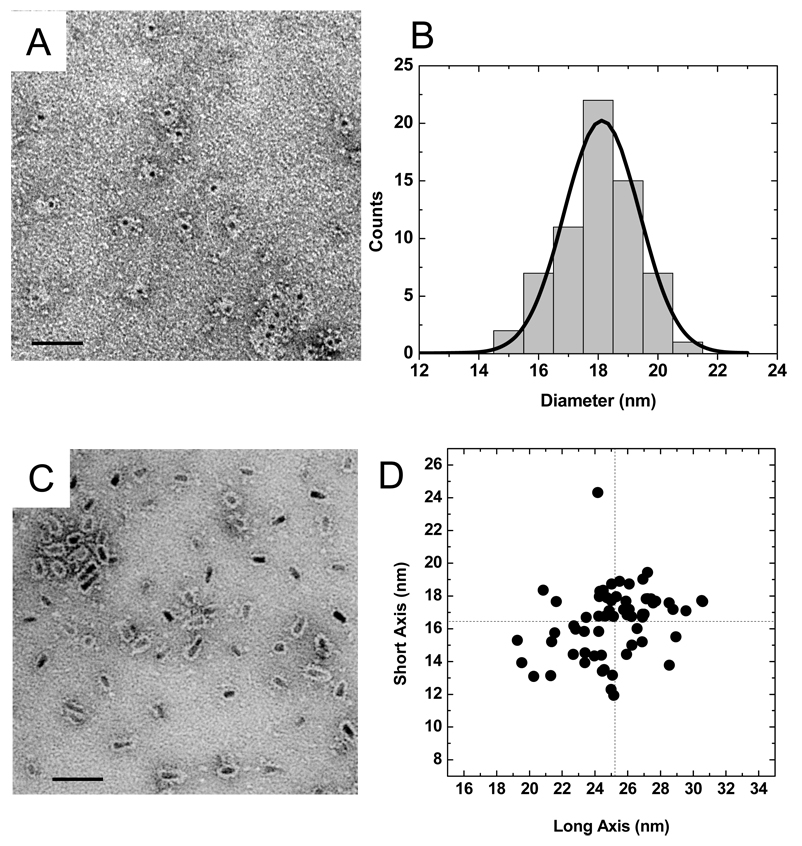
TEM images of QDs. QD size and shape measurements. A: TEM images of SAV-QD585, B: corresponding size histogram. C: TEM images of SAV-QD655, D: Scatter plot of (length, width) measurements for the SAV-QD655. A typical rod-like aspect ratio of 1.5 is observed.
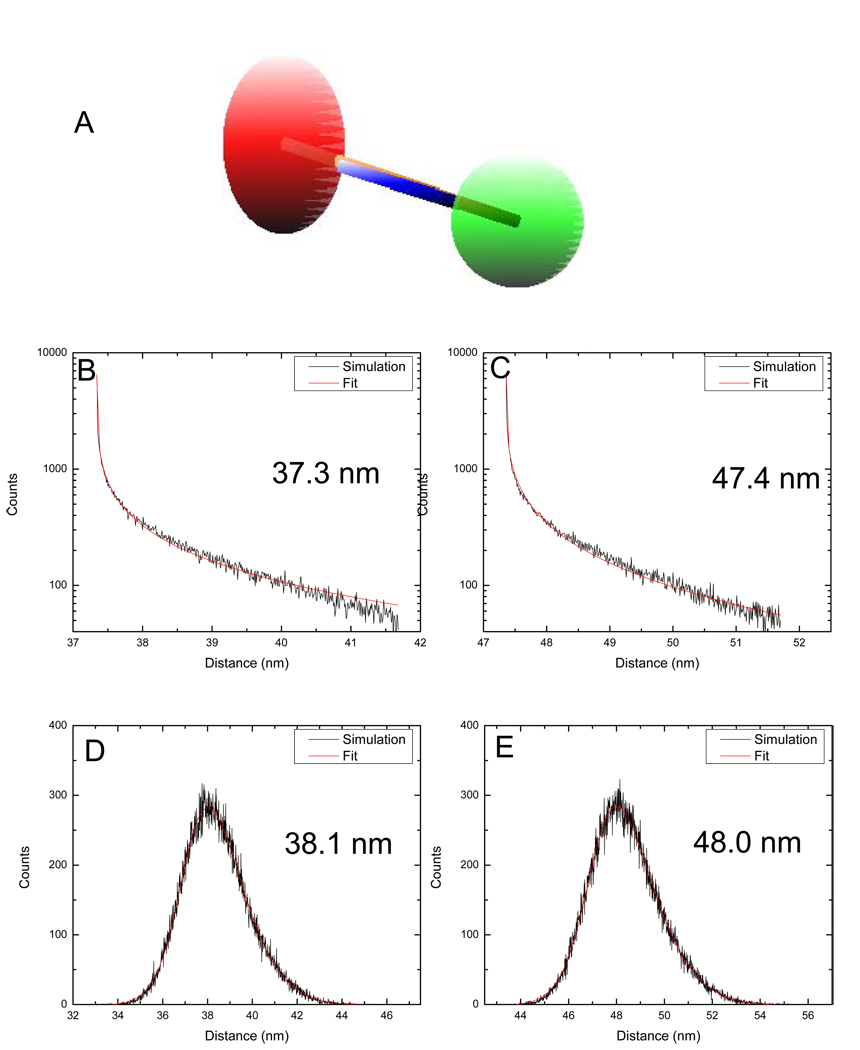
Estimation of the effect of QD geometry of the measured distribution of distance. A: The geometrical model used here represents the SAV-QD585 (green) as spheres of diameter 18.1 ± 1.3 nm and SAV-QD655 (red) as ellipsoids of revolution with a long axis of 25.2 ± 2.5 nm and a short axis of 16.5 ± 2.1 nm. DNA (blue) is orthogonal to the ellipsoid and the sphere. The computed distance is the distance between the two centers (orange rod). B, C: Distribution of computed distances obtained when assuming that perfect ellipsoids with long (resp. short) axis of 25.2 nm (resp. 16.5 nm) are connected by 20.04 nm (B) or 30.06 nm (C) long rod-like DNA attached randomly on the QDs. The curves were fit with a stretched exponential. D, E: Distribution of computed distances obtained when the ellipsoid parameters were taken from the observed distribution. The fitted curves are asymmetric Gaussian distributions. In (B–E), the values reported on the graphs correspond to the positions of the peaks.
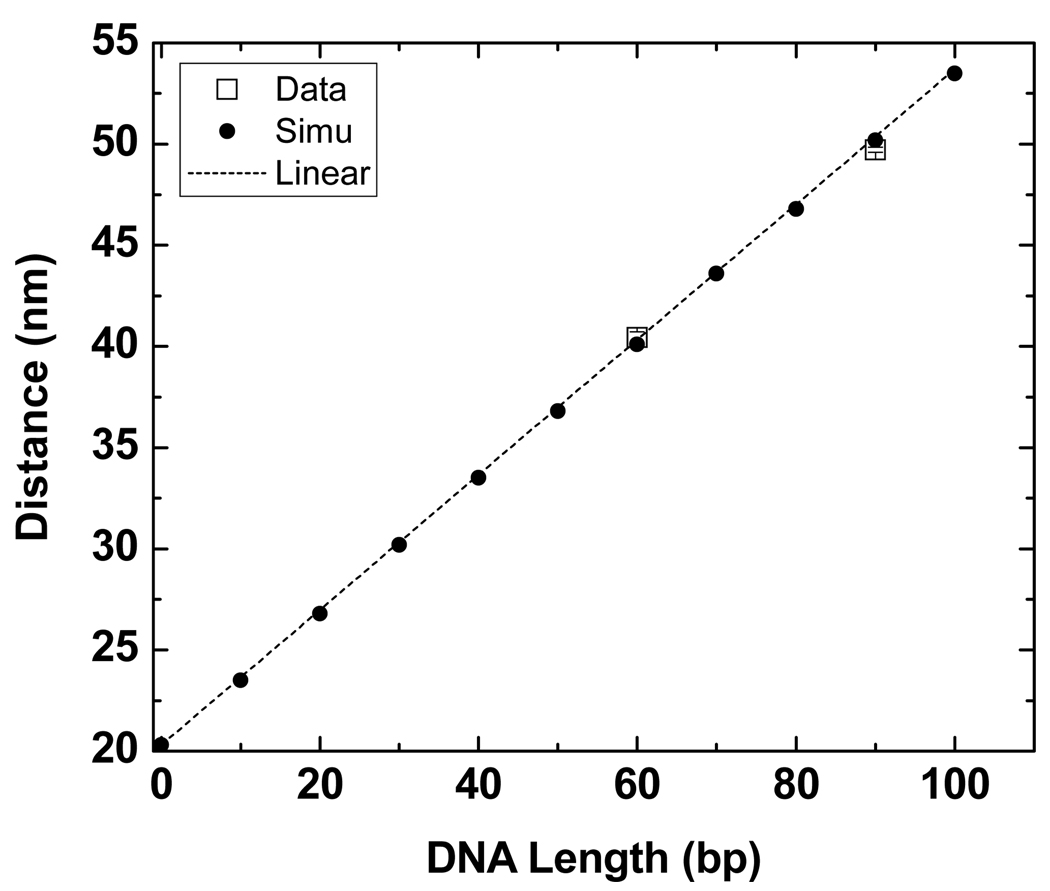
Measured distance as a function of DNA length (in bp). Square data points correspond to the optical measurements of this work. Filled circles correspond to simulated data including the effect of QD shape distribution, a 1 nm linker contribution, and 0.334 nm per bp (but no SPAD offset since it has minimal effects on the average distance). The dashed line corresponds to d = 20.3 + 0.334 × base pairs.
Similar articles
-
Detection of single DNA molecules by multicolor quantum-dot end-labeling.Nucleic Acids Res. 2005 Jun 20;33(11):e98. doi: 10.1093/nar/gni097. Nucleic Acids Res. 2005. PMID: 15967805 Free PMC article.
-
Single-step multicolor fluorescence in situ hybridization using semiconductor quantum dot-DNA conjugates.Cell Biochem Biophys. 2006;45(1):59-70. doi: 10.1385/CBB:45:1:59. Cell Biochem Biophys. 2006. PMID: 16679564 Free PMC article.
-
Superlocalization spectral imaging microscopy of a multicolor quantum dot complex.Anal Chem. 2012 Feb 7;84(3):1504-9. doi: 10.1021/ac202784h. Epub 2012 Jan 24. Anal Chem. 2012. PMID: 22304482
-
Quantum Dot-Based Simultaneous Multicolor Imaging.Mol Imaging Biol. 2020 Aug;22(4):820-831. doi: 10.1007/s11307-019-01432-4. Mol Imaging Biol. 2020. PMID: 31529409 Review.
-
Quantum dot: magic nanoparticle for imaging, detection and targeting.Acta Biomed. 2009 Aug;80(2):156-65. Acta Biomed. 2009. PMID: 19848055 Review.
Cited by
-
Imaging nanometre-scale structure in cells using in situ aberration correction.J Microsc. 2012 Oct;248(1):90-101. doi: 10.1111/j.1365-2818.2012.03654.x. Epub 2012 Aug 20. J Microsc. 2012. PMID: 22906048 Free PMC article.
-
Assessment of the Toxicity of Quantum Dots through Biliometric Analysis.Int J Environ Res Public Health. 2021 May 27;18(11):5768. doi: 10.3390/ijerph18115768. Int J Environ Res Public Health. 2021. PMID: 34072155 Free PMC article.
-
Subnanometre single-molecule localization, registration and distance measurements.Nature. 2010 Jul 29;466(7306):647-51. doi: 10.1038/nature09163. Epub 2010 Jul 7. Nature. 2010. PMID: 20613725
-
Probing the "dark" fraction of core-shell quantum dots by ensemble and single particle pH-dependent spectroscopy.ACS Nano. 2011 Nov 22;5(11):9062-73. doi: 10.1021/nn203272p. Epub 2011 Oct 28. ACS Nano. 2011. PMID: 22023370 Free PMC article.
-
Direct optical mapping of transcription factor binding sites on field-stretched λ-DNA in nanofluidic devices.Nucleic Acids Res. 2014 Jun;42(10):e85. doi: 10.1093/nar/gku254. Epub 2014 Apr 21. Nucleic Acids Res. 2014. PMID: 24753422 Free PMC article.
References
Publication types
MeSH terms
Substances
Grants and funding
LinkOut - more resources
Full Text Sources
Other Literature Sources
Molecular Biology Databases
