

Physiogenomic analysis of the Puerto Rican population
- PMID: 19374515
- PMCID: PMC2846824
- DOI: 10.2217/pgs.09.5
Physiogenomic analysis of the Puerto Rican population
Abstract
Aims: Admixture in the population of the island of Puerto Rico is of general interest with regards to pharmacogenetics to develop comprehensive strategies for personalized healthcare in Latin Americans. This research was aimed at determining the frequencies of SNPs in key physiological, pharmacological and biochemical genes to infer population structure and ancestry in the Puerto Rican population.
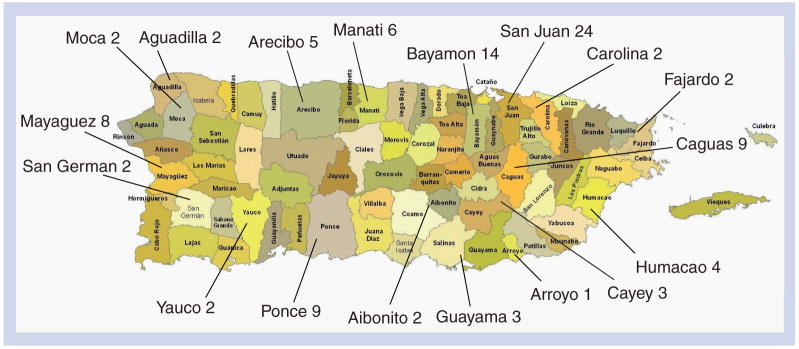
Materials & methods: A noninterventional, cross-sectional, retrospective study design was implemented following a controlled, stratified-by-region, random sampling protocol. The sample was based on birthrates in each region of the island of Puerto Rico, according to the 2004 National Birth Registry. Genomic DNA samples from 100 newborns were obtained from the Puerto Rico Newborn Screening Program in dried-blood spot cards. Genotyping using a physiogenomic array was performed for 332 SNPs from 196 cardiometabolic and neuroendocrine genes. Population structure was examined using a Bayesian clustering approach as well as by allelic dissimilarity as a measure of allele sharing.
Results: The Puerto Rican sample was found to be broadly heterogeneous. We observed three main clusters in the population, which we hypothesize to reflect the historical admixture in the Puerto Rican population from Amerindian, African and European ancestors. We present evidence for this interpretation by comparing allele frequencies for the three clusters with those for the same SNPs available from the International HapMap project for Asian, African and European populations.
Conclusion: Our results demonstrate that population analysis can be performed with a physiogenomic array of cardiometabolic and neuroendocrine genes to facilitate the translation of genome diversity into personalized medicine.
Figures


References
Bibliography
-
- Kalow W. Pharmacogenetics of Drug Metabolism. Elsevier Science Publishing Co; USA: 1992. Very useful and comprehensive overview of pharmacogenetics, it brings together many different facets of polymorphic drug biotransformation and features thorough reviews of drug-metabolizing reactions that show genetic variability between humans.
-
- Saltelli A, Chan K, Scott EM. Sensitivity Analysis. John Wiley and Sons; Chichester, UK: 2000.
-
- Suarez-Kurtz G, Pena SD. Pharmacogenomics in the Americas: the impact of genetic admixture. Curr Drug Targets. 2006;7:1649–1658. Compilation of pharmacogenomics data from peoples of different geographic regions, where admixture and population stratification occur in distinct patterns. - PubMed
-
- Jakobsson M, Scholz SW, Scheet P, et al. Genotype, haplotype and copy-number variation in worldwide human populations. Nature. 2008;451:998–1003. - PubMed
Websites
-
- USA Census Bureau. 2000. www.census.gov.
-
- The University of Chicago Department of Biological Sciences, Pritchard Lab . http://pritch.bsd.uchicago.edu.
Patent
-
- Ruaño G. Physiogenomic method for predicting clinical outcomes of treatments in patients. 20060278241. 2006. pp. 12–14.
Publication types
MeSH terms
Substances
Grants and funding
LinkOut - more resources
Full Text Sources
Medical