

doi: 10.1186/gb-2009-10-4-r37.
Epub 2009 Apr 19.
Chromatin conformation signatures of cellular differentiation
Affiliations
- PMID: 19374771
- PMCID: PMC2688928
- DOI: 10.1186/gb-2009-10-4-r37
Item in Clipboard
Chromatin conformation signatures of cellular differentiation
Genome Biol.
2009.
Abstract
One of the major genomics challenges is to better understand how correct gene expression is orchestrated. Recent studies have shown how spatial chromatin organization is critical in the regulation of gene expression. Here, we developed a suite of computer programs to identify chromatin conformation signatures with 5C technology http://Dostielab.biochem.mcgill.ca. We identified dynamic HoxA cluster chromatin conformation signatures associated with cellular differentiation. Genome-wide chromatin conformation signature identification might uniquely identify disease-associated states and represent an entirely novel class of human disease biomarkers.
Figures

Capturing spatial chromatin organization in vivo with 3C/5C technologies. (a) Current model of genome organization in the interphase nucleus. The diagram illustrates multiple levels of chromatin folding from the primary structural unit consisting of genomic DNA bound to nucleosomes (10 nm fiber; left). Secondary organization levels involve formation of 30 nm fibers through nucleosome-nucleosome interactions, and binding of individual fibers is believed to form tertiary structures (top). Folded chromatin occupies 'chromosome territories' represented by green, blue or orange shaded areas (right). Yellow circles indicate physical DNA contacts within (intra) or between (inter) chromosomes. (b) Schematic representation of 3C technology. 3C measures in vivo cross-linked DNA contacts at high resolution using individual PCR amplification and agarose gel detection. Interacting DNA segments located in cis is shown as an example to illustrate the 3C approach. Cis-interacting DNA fragments are represented by green and orange arrows and separated by a given genomic region (yellow line; left). Yellow circles represent cross-linked proteins. DNA segments are illustrated by arrows to highlight 'head-to-head' ligation configurations quantified by 3C. (c) Schematic representation of the 5C technology. 5C measures DNA contacts from 3C libraries using multiplex ligation-mediated amplification and microarray or high-throughput DNA sequencing. Genomic homology regions of 5C primers are shown in green and orange, and universal primer sequences are colored dark green or blue.
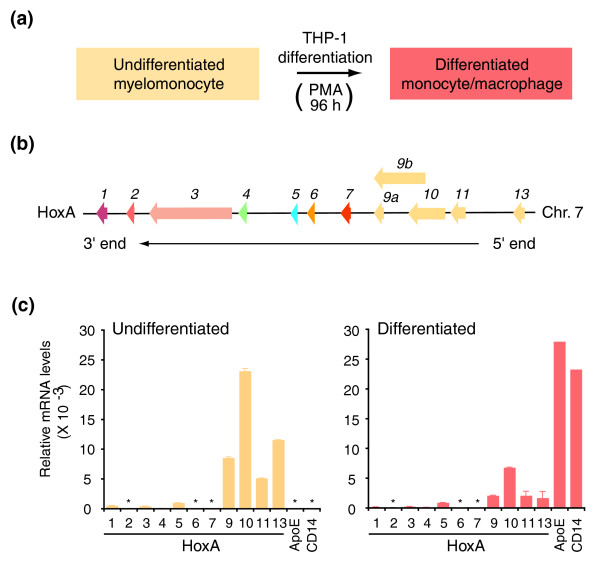
5' end HoxA genes are repressed during cellular differentiation. (a) Cellular differentiation system used in this study. The human myelomonocytic cell line THP1 was stimulated with PMA to cease proliferation and induce differentiation into mature monocytes/macrophages. (b) Linear schematic representation of the human HoxA gene cluster on chromosome 7. Genes are represented by left facing arrows to indicate direction of transcription. Cluster is presented in a 3' (HoxA1) to 5' (HoxA13) orientation. Same family members are labeled with identical color. Paralogue groups (1-13) are identified above each gene. (c) Quantitative real-time PCR analysis of HoxA genes during cellular differentiation. Steady-state mRNA levels in undifferentiated (left) and differentiated cells (right) were normalized relative to actin. CD14 and ApoE expression levels were measured to verify cellular differentiation. Number below each histogram bar identifies paralogue group. Asterisks indicate mRNA expression below quantitative real-time PCR detection levels. Each histogram value is the average of at least three PCRs and error bars represent the standard deviation.
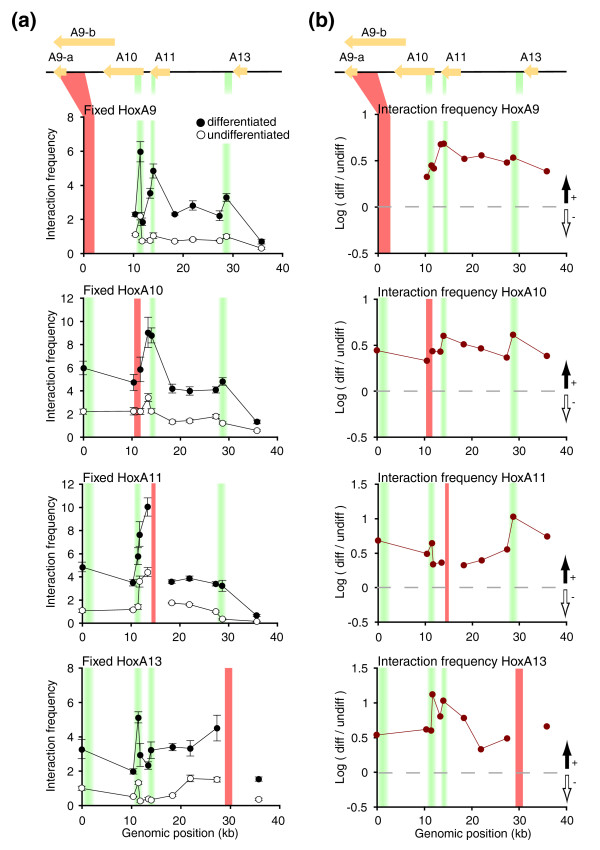
Extensive spatial chromatin remodeling accompanies 5' HoxA gene repression during cellular differentiation. (a) Conventional 3C analysis of transcriptionally regulated HoxA genes. Chromatin contacts between the HoxA9, A10, A11, or A13 genes and surrounding genomic domain were measured in undifferentiated and differentiated cells. The y-axis indicates normalized interaction frequency; the x-axis shows genomic position relative to start of domain characterized. The genomic domain is shown to scale above the graphs, and is as described in Figure 2b. Solid orange vertical lines identify the position of the 'fixed' 3C region analyzed in each graph. Shaded green vertical lines highlight the position of putative DNA looping contacts. Each data point is the average of at least three PCRs. Error bars represent the standard error of the mean. (b) Chromatin contact changes during cellular differentiation. 3C interactions between the HoxA9, A10, A11, or A13 genes and surrounding genomic domain presented in (a) were compared in both cellular states by calculating fold differences (log ratio differentiated/undifferentiated). Areas above and below horizontal dashed lines represent increased and reduced interactions in differentiated cells, respectively (black and white vertical arrows). The genomic domain is shown to scale above the graphs as in (a). Interaction frequencies represent the average of at least three PCRs and error bars represent the standard error of the mean.
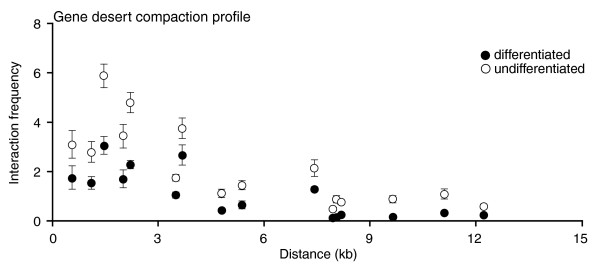
The chromatin compaction of a gene desert control region does not significantly change during cellular differentiation. The y-axis indicates interaction frequency and the x-axis shows genomic distance between interacting fragments. The average log ratio of corresponding contacts in undifferentiated and differentiated cells from this dataset was used to normalize the HoxA 3C datasets shown in Figure 3a. Interaction frequencies represent the average of at least three PCRs and error bars represent the standard error of the mean.
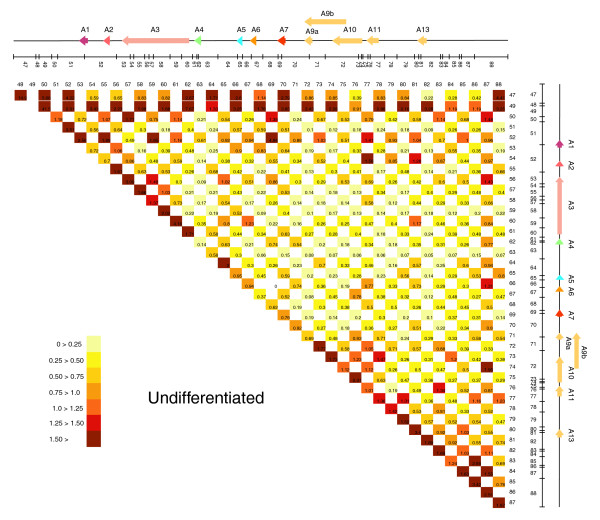
5C array analysis of chromatin conformation changes in the HoxA cluster during cellular differentiation. HoxA chromatin contacts in undifferentiated cells are presented as a two-dimensional heat map. Pair-wise interaction frequencies between restriction fragments were detected by 5C and measured on custom microarrays. A linear diagram of the HoxA gene cluster is presented at the top and right borders and is as described in Figure 2b. A predicted BglII restriction pattern is illustrated below the HoxA diagram and is to scale. Restriction fragments were identified from left to right by the numbers indicated below each line. Intersecting column and row numbers identify DNA contact. Values within each square represent interaction frequencies and are color-coded. The color scale is shown in the bottom left inserts, with pale yellow to brown indicating very weak to strongest contacts. Interaction frequencies are the average of at least three array technical repeats. Note: primer 48 was included during large-scale 5C library production but was excluded from our analysis because of homology to repetitive sequences.

5C array analysis of chromatin conformation changes in the HoxA cluster during cellular differentiation. HoxA chromatin contacts in differentiated cells are presented as a two-dimensional heat map as described in Figure 5.

Extensive HoxA spatial chromatin remodeling during cellular differentiation involves the transcriptionally regulated 5' end region. (a) 5C chromatin interaction profiles with the greatest differences between undifferentiated and differentiated states were extracted from 5C datasets. The normalized interaction frequency is plotted logarithmically on the y-axis to emphasize differences between cellular states. The x-axis shows genomic position relative to the start of the domain analyzed. The linear HoxA cluster diagram and predicted BglII restriction pattern are shown to scale above the graphs, and are as described in Figures 2b, 5 & 6. Solid orange vertical lines identify the position of 'fixed' 5C interaction profiles presented in each graph. Shaded green vertical lines highlight position of putative 3'-5' looping regions. Each data point is the average of at least three array interaction frequencies. Error bars represent the standard error of the mean. (b) 5C chromatin compaction of a gene desert control region does not change during differentiation. The y-axis indicates interaction frequency and the x-axis shows genomic distance between interacting fragments. The average log ratio of corresponding contacts in undifferentiated and differentiated cells from this dataset was used to normalize HoxA 5C datasets shown in Figures 5 & 6 and in (a). Interaction frequencies represent the average of at least three array interaction frequencies and error bars represent the standard error of the mean.

Three-dimensional models of the human HoxA cluster during cellular differentiation. 5C array datasets from (a) undifferentiated and (b) differentiated samples were used to predict models of the HoxA cluster with the 5C3D program. Green lines represent genomic DNA and vertices define boundaries between consecutive restriction fragments. Colored spheres represent transcription start sites of HoxA genes as described in the legend. (c) Increased local genomic density surrounding 5' HoxA transcription start sites accompanies cellular differentiation. The y-axis indicates local genomic density and HoxA paralogue groups are identified on the x-axis. A linear schematic representation of the HoxA cluster is shown at the top, and green shading highlights the region of greatest density change. Error bars represent standard deviations.
References
-
- Sell S. Leukemia: stem cells, maturation arrest, and differentiation therapy. Stem Cell Rev. 2005;1:197–205. - PubMed
-
- Rosenbauer F, Tenen DG. Transcription factors in myeloid development: balancing differentiation with transformation. Nat Rev Immunol. 2007;7:105–117. - PubMed
-
- The FANTOM Consortium. Suzuki H, Forrest A, van Nimwegen E, Daub C, Balwierz P, Irvine K, Lassman T, Ravasi T, Hasegawa Y, de Hoon M, Katayama S, Schroder K, Carninci P, Akalin A, Ando Y, Arner E, Asada M, Asahara H, Bailey T, Bajic VB, Bauer D, Beckhouse A, Bertin N, Björkegren J, Brombacher F, Bulger E, Chalk AM, Chiba J, Cloonan N, et al. The transcriptional network that controls growth arrest and differentiation in a human myeloid leukemia cell line. Nat Genet. 2009. - PMC - PubMed
-
- West AG, Fraser P. Remote control of gene transcription. Hum Mol Genet. 2005;14:R101–111. - PubMed
Publication types
MeSH terms
Substances
LinkOut - more resources
Full Text Sources
Other Literature Sources
