. 2009;10(4):R38.
doi: 10.1186/gb-2009-10-4-r38. Epub 2009 Apr 19.

Transcriptional features of genomic regulatory blocks

Affiliations

Transcriptional features of genomic regulatory blocks

Altuna Akalin et al. Genome Biol. 2009.

Abstract

Background: Genomic regulatory blocks (GRBs) are chromosomal regions spanned by highly conserved non-coding elements (HCNEs), most of which serve as regulatory inputs of one target gene in the region. The target genes are most often transcription factors involved in embryonic development and differentiation. GRBs often contain extensive gene deserts, as well as additional 'bystander' genes intertwined with HCNEs but whose expression and function are unrelated to those of the target gene. The tight regulation of target genes, complex arrangement of regulatory inputs, and the differential responsiveness of genes in the region call for the examination of fundamental rules governing transcriptional activity in GRBs. Here we use extensive CAGE tag mapping of transcription start sites across different human tissues and differentiation stages combined with expression data and a number of sequence and epigenetic features to discover these rules and patterns.

Results: We show evidence that GRB target genes have properties that set them apart from their bystanders as well as other genes in the genome: longer CpG islands, a higher number and wider spacing of alternative transcription start sites, and a distinct composition of transcription factor binding sites in their core/proximal promoters. Target gene expression correlates with the acetylation state of HCNEs in the region. Additionally, target gene promoters have a distinct combination of activating and repressing histone modifications in mouse embryonic stem cell lines.

Conclusions: GRB targets are genes with a number of unique features that are the likely cause of their ability to respond to regulatory inputs from very long distances.


Figures

Figure 1
Figure 1
Definition of key terms. (a) The genomic regulatory block model and its possible evolutionary fate after whole genome duplication. Many HCNEs act as long-range regulators of target genes, while having no effect on bystander genes. The target gene is kept in both zebrafish copies of the loci, along with HCNEs, whereas bystander genes are differentially lost. (b) Tag clusters (TCs) are defined as overlapping CAGE tags (red horizontal arrows). Each distinct CAGE tag start corresponds to a CTSS. CTSSs are shown as vertical bars in the bottom track with the height of each bar corresponding to the number of CAGE tags for that CTSS.
Figure 2
Figure 2
Density of TCs in target genes compared to bystander genes, other CpG genes and other TFs. Average TC density calculated in sliding windows of 250 bp over a 4,000 bp region for each gene set. Average TC densities with 90% confidence intervals of bystanders, other CpG island genes, and other TFs are compared with target genes. (a) TC frequencies of targets and bystanders. (b) TC frequencies of targets and other CpG genes. (c) TC frequencies of targets and other TFs.
Figure 3
Figure 3
Cumulative distribution function of the maximum distance between distinct Ensembl TSSs covered by CAGE TCs for target and bystander genes. The distances for target genes are significantly larger (Wilcoxon test p-value = 0.0121) than those of bystander genes.
Figure 4
Figure 4
Definition of top-level clusters. Top-level clusters (top) were obtained by overlapping defined core promoter regions (-300, +100 bp) of CTSSs. If core-promoters of CTSSs overlap, they are clustered together. Blue regions denote core promoter regions for each CTSS (red bars).
Figure 5
Figure 5
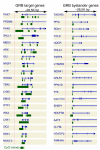
Examples of CpG islands covering target and bystander genes. Compared to bystander genes, target genes are typically covered by more and longer CpG islands (green rectangles). Genes are depicted in blue structures showing exon-intron configuration.
Figure 6
Figure 6
Cumulative distribution function plots for CpG island length, CpG island count and CpG island length to gene length ratio. In all of the plots, the values for target genes are significantly larger than other analyzed sets of genes (bystander genes, other CpG-covered genes and other TFs). (a) CpG scores for target genes and bystander genes. (b) CpG scores for target genes and other CpG island genes. (c) CpG scores for target genes and other TFs.
Figure 7
Figure 7
Average CpG scores for an 8,000 bp window around the most used TSS for targets, bystanders, other CpG genes and other TFs. CpG scores are significantly higher for target gene promoter regions than for background sets. The error bars indicate 90% confidence interval for the average scores. (a) Average CpG scores for targets genes and bystander genes. (b) Average CpG scores for targets genes and other CpG island genes. (c) Average CpG scores for targets genes and other TFs.
Figure 8
Figure 8
Illustration of main conclusions about properties of GRB target genes. Distinct tracks under the target gene and bystander gene models describe the properties of target genes in a comparative manner.

References

    1. Sandelin A, Bailey P, Bruce S, Engstrom PG, Klos JM, Wasserman WW, Ericson J, Lenhard B. Arrays of ultraconserved non-coding regions span the loci of key developmental genes in vertebrate genomes. BMC Genomics. 2004;5:99. doi: 10.1186/1471-2164-5-99. - DOI - PMC - PubMed
    1. Woolfe A, Goodson M, Goode DK, Snell P, McEwen GK, Vavouri T, Smith SF, North P, Callaway H, Kelly K, Walter K, Abnizova I, Gilks W, Edwards YJ, Cooke JE, Elgar G. Highly conserved non-coding sequences are associated with vertebrate development. PLoS Biol. 2005;3:e7. doi: 10.1371/journal.pbio.0030007. - DOI - PMC - PubMed
    1. de la Calle-Mustienes E, Feijoo CG, Manzanares M, Tena JJ, Rodriguez-Seguel E, Letizia A, Allende ML, Gomez-Skarmeta JL. A functional survey of the enhancer activity of conserved non-coding sequences from vertebrate Iroquois cluster gene deserts. Genome Res. 2005;15:1061–1072. doi: 10.1101/gr.4004805. - DOI - PMC - PubMed
    1. Pennacchio LA, Ahituv N, Moses AM, Prabhakar S, Nobrega MA, Shoukry M, Minovitsky S, Dubchak I, Holt A, Lewis KD, Plajzer-Frick I, Akiyama J, De Val S, Afzal V, Black BL, Couronne O, Eisen MB, Visel A, Rubin EM. In vivo enhancer analysis of human conserved non-coding sequences. Nature. 2006;444:499–502. doi: 10.1038/nature05295. - DOI - PubMed
    1. Kimura-Yoshida C, Kitajima K, Oda-Ishii I, Tian E, Suzuki M, Yamamoto M, Suzuki T, Kobayashi M, Aizawa S, Matsuo I. Characterization of the pufferfish Otx2 cis-regulators reveals evolutionarily conserved genetic mechanisms for vertebrate head specification. Development. 2004;131:57–71. doi: 10.1242/dev.00877. - DOI - PubMed

Publication types