

Data-driven normalization strategies for high-throughput quantitative RT-PCR
- PMID: 19374774
- PMCID: PMC2680405
- DOI: 10.1186/1471-2105-10-110
Data-driven normalization strategies for high-throughput quantitative RT-PCR
Abstract
Background: High-throughput real-time quantitative reverse transcriptase polymerase chain reaction (qPCR) is a widely used technique in experiments where expression patterns of genes are to be profiled. Current stage technology allows the acquisition of profiles for a moderate number of genes (50 to a few thousand), and this number continues to grow. The use of appropriate normalization algorithms for qPCR-based data is therefore a highly important aspect of the data preprocessing pipeline.
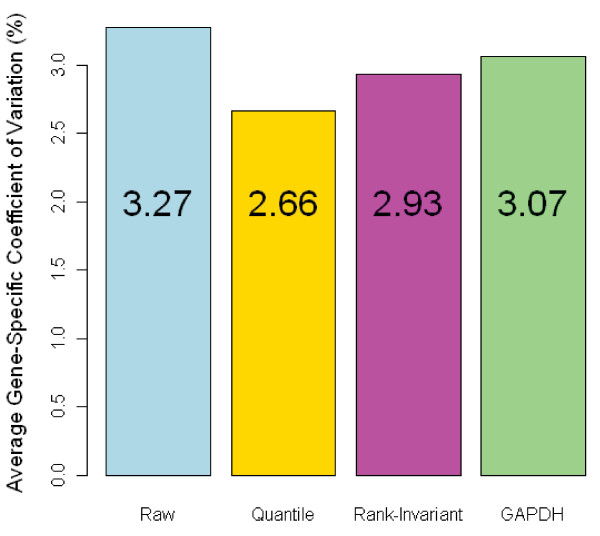
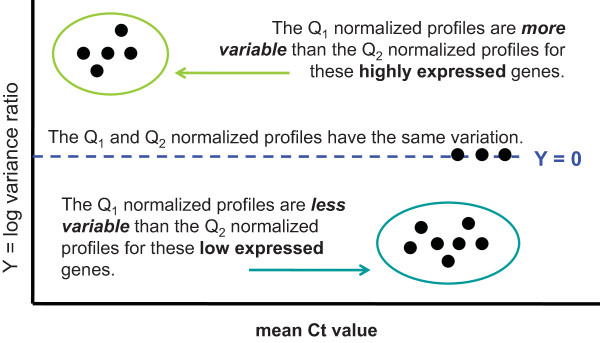
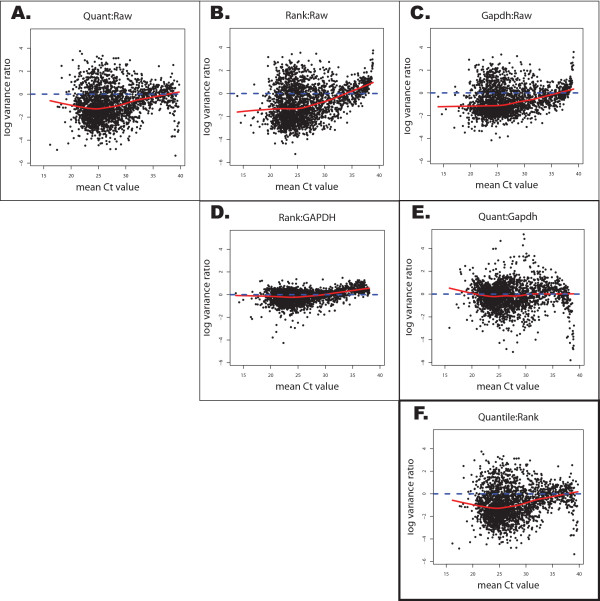
Results: We present and evaluate two data-driven normalization methods that directly correct for technical variation and represent robust alternatives to standard housekeeping gene-based approaches. We evaluated the performance of these methods against a single gene housekeeping gene method and our results suggest that quantile normalization performs best. These methods are implemented in freely-available software as an R package qpcrNorm distributed through the Bioconductor project.
Conclusion: The utility of the approaches that we describe can be demonstrated most clearly in situations where standard housekeeping genes are regulated by some experimental condition. For large qPCR-based data sets, our approaches represent robust, data-driven strategies for normalization.
Figures
Similar articles
-
Identification and evaluation of new reference genes in Gossypium hirsutum for accurate normalization of real-time quantitative RT-PCR data.BMC Plant Biol. 2010 Mar 21;10:49. doi: 10.1186/1471-2229-10-49. BMC Plant Biol. 2010. PMID: 20302670 Free PMC article.
-
The dilution effect and the importance of selecting the right internal control genes for RT-qPCR: a paradigmatic approach in fetal sheep.BMC Res Notes. 2015 Feb 27;8:58. doi: 10.1186/s13104-015-0973-7. BMC Res Notes. 2015. PMID: 25881111 Free PMC article.
-
RefGenes: identification of reliable and condition specific reference genes for RT-qPCR data normalization.BMC Genomics. 2011 Mar 21;12:156. doi: 10.1186/1471-2164-12-156. BMC Genomics. 2011. PMID: 21418615 Free PMC article.
-
Selection and validation of reference genes for gene expression studies in Klebsiella pneumoniae using Reverse Transcription Quantitative real-time PCR.Sci Rep. 2018 Jun 13;8(1):9001. doi: 10.1038/s41598-018-27420-2. Sci Rep. 2018. PMID: 29899556 Free PMC article.
-
Twenty-five years of quantitative PCR for gene expression analysis.Biotechniques. 2008 Apr;44(5):619-26. doi: 10.2144/000112776. Biotechniques. 2008. PMID: 18474036 Review.
Cited by
-
Evaluation of normalization methods to pave the way towards large-scale LC-MS-based metabolomics profiling experiments.OMICS. 2013 Sep;17(9):473-85. doi: 10.1089/omi.2013.0010. Epub 2013 Jun 29. OMICS. 2013. PMID: 23808607 Free PMC article.
-
Irreversible effects of trichloroethylene on the gut microbial community and gut-associated immune responses in autoimmune-prone mice.J Appl Toxicol. 2019 Feb;39(2):209-220. doi: 10.1002/jat.3708. Epub 2018 Sep 5. J Appl Toxicol. 2019. PMID: 30187502 Free PMC article.
-
A miRNA expression signature that separates between normal and malignant prostate tissues.Cancer Cell Int. 2011 May 27;11(1):14. doi: 10.1186/1475-2867-11-14. Cancer Cell Int. 2011. PMID: 21619623 Free PMC article.
-
Normalizing real-time PCR results in routine testing.J Vet Diagn Invest. 2024 Jan;36(1):78-85. doi: 10.1177/10406387231206080. Epub 2023 Nov 2. J Vet Diagn Invest. 2024. PMID: 37919959 Free PMC article.
-
Data Pre-Processing for Label-Free Multiple Reaction Monitoring (MRM) Experiments.Biology (Basel). 2014 Jun 5;3(2):383-402. doi: 10.3390/biology3020383. Biology (Basel). 2014. PMID: 24905083 Free PMC article.
References
-
- Arany ZP. High-throughput quantitative real-time PCR. In: Haines JL et al, editor. Current Protocols in Human Genetics. Vol. 58. New Jersey: John Wiley & Sons, Inc; 2008. pp. 11.10.1–11.10.11. - PubMed
-
- VanGuilder HD, Vrana KE, Freeman WM. Twenty-five years of quantitative PCR for gene expression analysis. Biotechniques . 2008;44:S619–S626. - PubMed
-
- Hamalainen HK, Tubman JC, Vikman S, Kyrola T, Ylikoski E, Warrington JA, Lahesmaa R. Identification and validation of endogenous reference genes for expression profiling of T helper cell differentiation by quantitative real-time RT-PCR. Anal Biochem. 2001;299:63–70. - PubMed
Publication types
MeSH terms
Grants and funding
LinkOut - more resources
Full Text Sources
Other Literature Sources
Molecular Biology Databases
