

Membrane cholesterol content influences binding properties of muscarinic M2 receptors and differentially impacts activation of second messenger pathways
- PMID: 19374848
- PMCID: PMC2675699
- DOI: 10.1016/j.ejphar.2009.01.028
Membrane cholesterol content influences binding properties of muscarinic M2 receptors and differentially impacts activation of second messenger pathways
Abstract
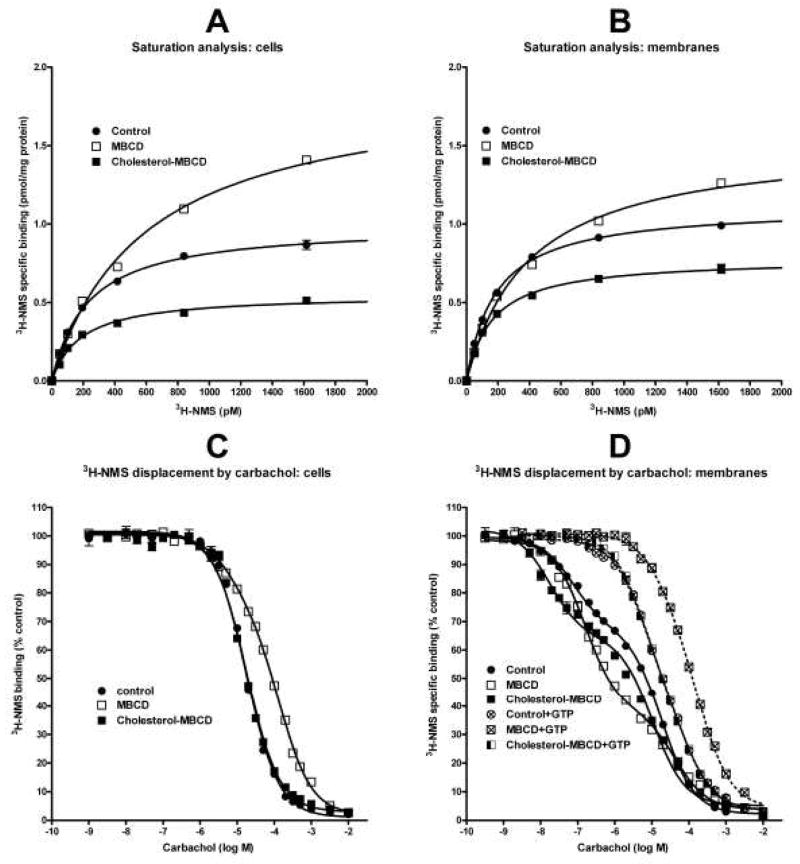
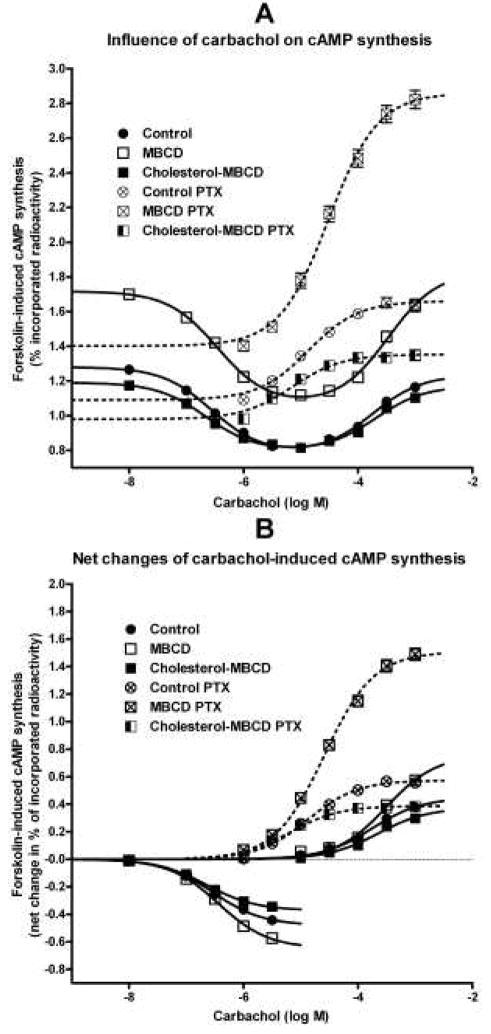
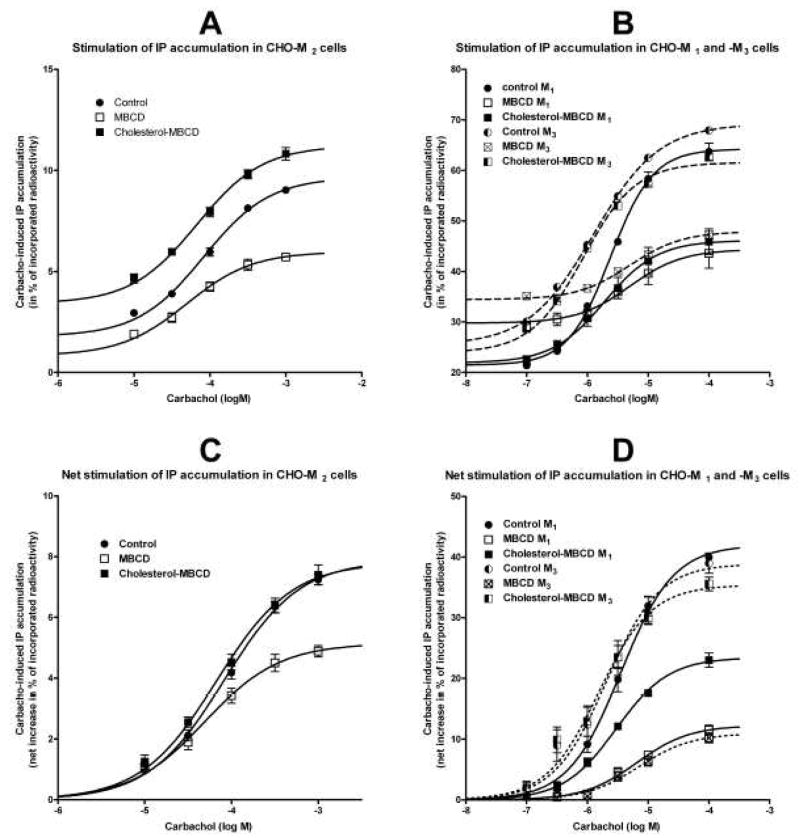
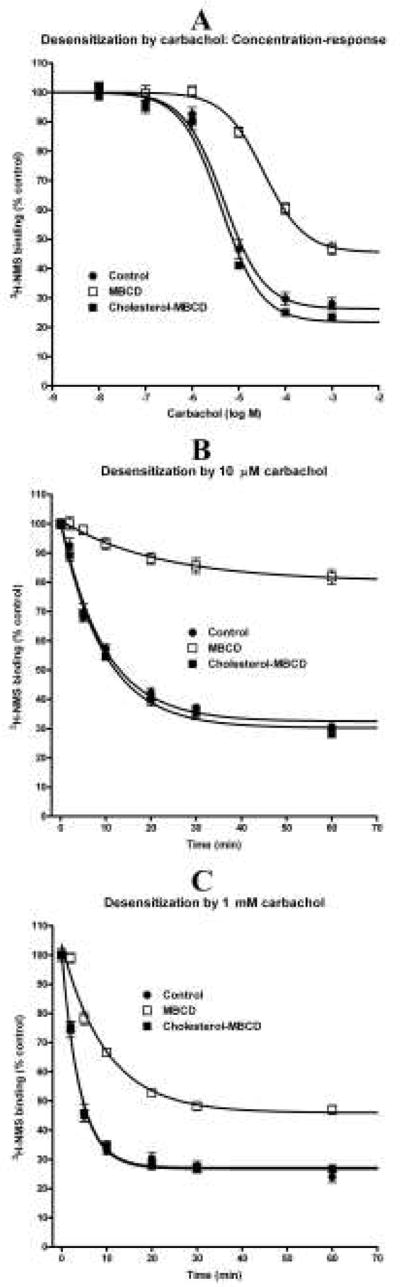
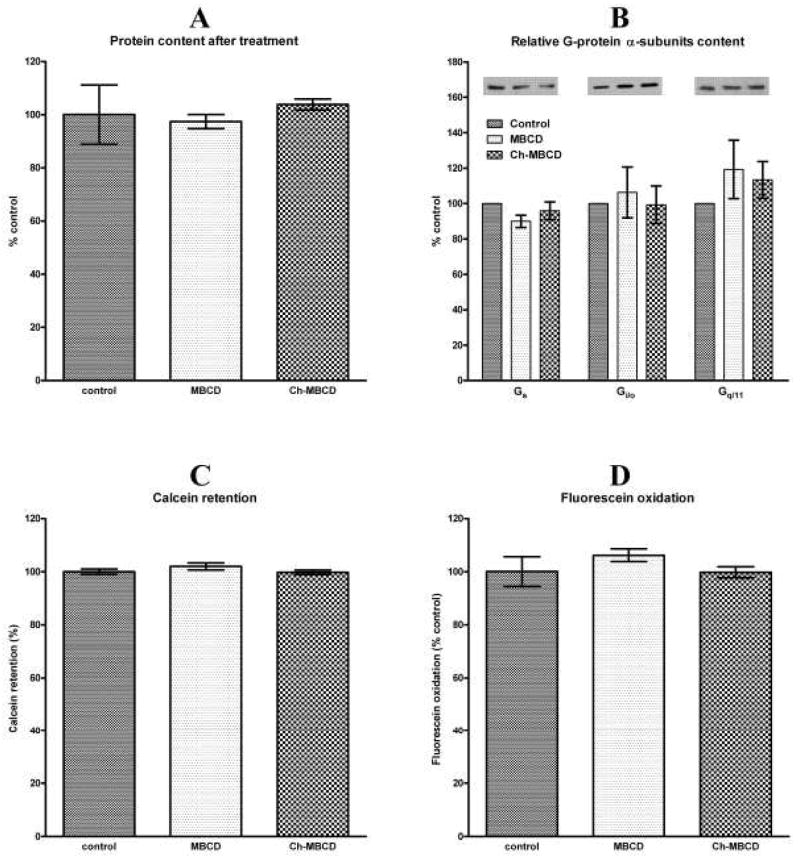
We investigated the influence of membrane cholesterol content on preferential and non-preferential signaling through the M(2) muscarinic acetylcholine receptor expressed in CHO cells. Cholesterol depletion by 39% significantly decreased the affinity of M(2) receptors for [(3)H]-N-methylscopolamine ([(3)H]-NMS) binding and increased B(max) in intact cells and membranes. Membranes displayed two-affinity agonist binding sites for carbachol and cholesterol depletion doubled the fraction of high-affinity binding sites. In intact cells it also reduced the rate of agonist-induced receptor internalization and changed the profile of agonist binding from a single site to two affinity states. Cholesterol enrichment by 137% had no effects on carbachol E(max) of cAMP synthesis inhibition and on cAMP synthesis stimulation and inositolphosphates (IP) accumulation at higher agonist concentrations (non-preferred pathways). On the other hand, cholesterol depletion significantly increased E(max) of cAMP synthesis inhibition or stimulation without change in potency, and decreased E(max) of IP accumulation. Noteworthy, modifications of membrane cholesterol had no effect on membrane permeability, oxidative activity, protein content, or relative expression of G(s), G(i/o), and G(q/11) alpha subunits. These results demonstrate distinct changes of M(2) receptor signaling through both preferential and non-preferential G-proteins consequent to membrane cholesterol depletion that occur at the level of receptor/G-protein/effector protein interactions in the cell membrane. The significant decrease of IP accumulation by cholesterol depletion was also observed in cells expressing M(3) receptors and by both cholesterol depletion and enrichment in cells expressing M(1) receptors indicating relevance of reduced G(q/11) signaling for the pathogenesis of Alzheimer's disease.
Figures
Similar articles
-
Subtype differences in pre-coupling of muscarinic acetylcholine receptors.PLoS One. 2011;6(11):e27732. doi: 10.1371/journal.pone.0027732. Epub 2011 Nov 16. PLoS One. 2011. PMID: 22110745 Free PMC article.
-
Changes in Membrane Cholesterol Differentially Influence Preferential and Non-preferential Signaling of the M1 and M3 Muscarinic Acetylcholine Receptors.Neurochem Res. 2015 Oct;40(10):2068-77. doi: 10.1007/s11064-014-1325-z. Epub 2014 May 13. Neurochem Res. 2015. PMID: 24821386 Free PMC article.
-
Negative cooperativity in binding of muscarinic receptor agonists and GDP as a measure of agonist efficacy.Br J Pharmacol. 2011 Mar;162(5):1029-44. doi: 10.1111/j.1476-5381.2010.01081.x. Br J Pharmacol. 2011. PMID: 20958290 Free PMC article.
-
Effects of chlorpyrifos oxon on M2 muscarinic receptor internalization in different cell types.J Toxicol Environ Health A. 2008;71(21):1440-7. doi: 10.1080/15287390802328887. J Toxicol Environ Health A. 2008. PMID: 18800293
-
Inhibition of acetylcholine muscarinic M(1) receptor function by the M(1)-selective ligand muscarinic toxin 7 (MT-7).Br J Pharmacol. 2000 Oct;131(3):447-52. doi: 10.1038/sj.bjp.0703606. Br J Pharmacol. 2000. PMID: 11015294 Free PMC article.
Cited by
-
Allosteric Modulation of GPCRs of Class A by Cholesterol.Int J Mol Sci. 2021 Feb 16;22(4):1953. doi: 10.3390/ijms22041953. Int J Mol Sci. 2021. PMID: 33669406 Free PMC article. Review.
-
Location and Cell-Type-Specific Bias of Metabotropic Glutamate Receptor, mGlu5, Negative Allosteric Modulators.ACS Chem Neurosci. 2019 Nov 20;10(11):4558-4570. doi: 10.1021/acschemneuro.9b00415. Epub 2019 Oct 28. ACS Chem Neurosci. 2019. PMID: 31609579 Free PMC article.
-
Platelet glycoprotein Ib beta/IX mediates glycoprotein Ib alpha localization to membrane lipid domain critical for von Willebrand factor interaction at high shear.J Biol Chem. 2011 Jun 17;286(24):21315-23. doi: 10.1074/jbc.M110.202549. Epub 2011 Apr 20. J Biol Chem. 2011. PMID: 21507943 Free PMC article.
-
Membrane cholesterol access into a G-protein-coupled receptor.Nat Commun. 2017 Feb 21;8:14505. doi: 10.1038/ncomms14505. Nat Commun. 2017. PMID: 28220900 Free PMC article.
-
Subtype differences in pre-coupling of muscarinic acetylcholine receptors.PLoS One. 2011;6(11):e27732. doi: 10.1371/journal.pone.0027732. Epub 2011 Nov 16. PLoS One. 2011. PMID: 22110745 Free PMC article.
References
-
- Abdulaev NG, Ngo T, Ramon E, Brabazon DM, Marino JP, Ridge KD. The receptor-bound „empty pocket“ state of the heterotrimeric G-protein alpha-subunit is conformationally dynamic. Biochemistry. 2006;45:12986–12997. - PubMed
-
- Azpiazu I, Gautam N. A fluorescence resonance energy transfer-based sensor indicates that receptor access to a G protein is unrestricted in a living mammalian cell. J Biol Chem. 2004;279:27709–27718. - PubMed
-
- Bonner TI. The molecular basis of muscarinic receptor diversity. Trends Neurosci. 1989;12:148–151. - PubMed
Publication types
MeSH terms
Substances
Grants and funding
LinkOut - more resources
Full Text Sources
Medical
