. 2009 May;37(5):604-15.
doi: 10.1016/j.exphem.2009.01.005.

Mesenchymal stem cells suppress B-cell terminal differentiation

Affiliations

Mesenchymal stem cells suppress B-cell terminal differentiation

Sadaki Asari et al. Exp Hematol. 2009 May.

Abstract

Objective: Mesenchymal stem cells (MSCs) have been shown to possess immunomodulatory properties on a diverse array of immune cell lineages. However, their effect on B lymphocytes remains unclear. We investigated the effect of MSCs on B-cell modulation with a special emphasis on gene regulation mediated by MSC humoral factors.

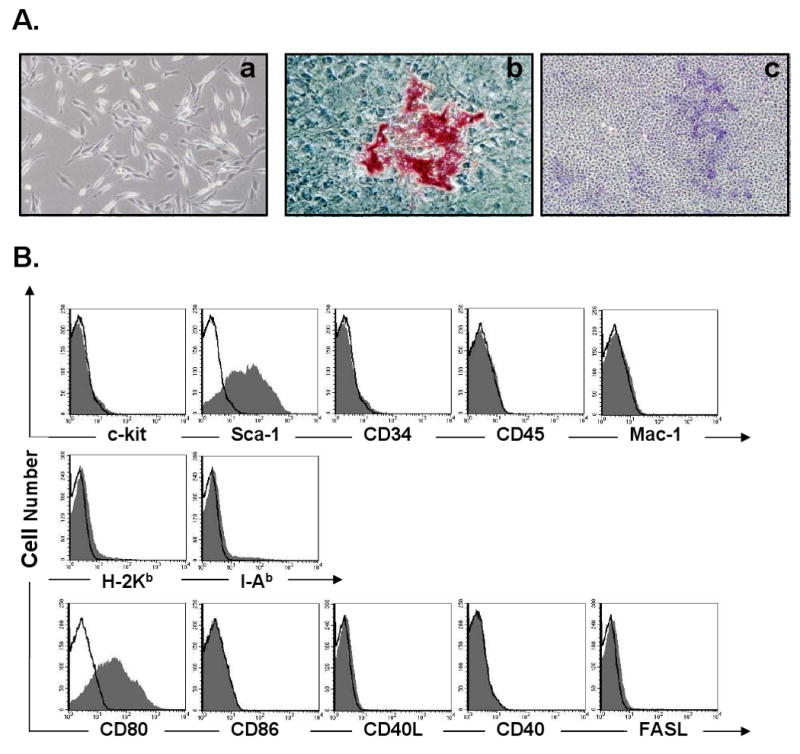
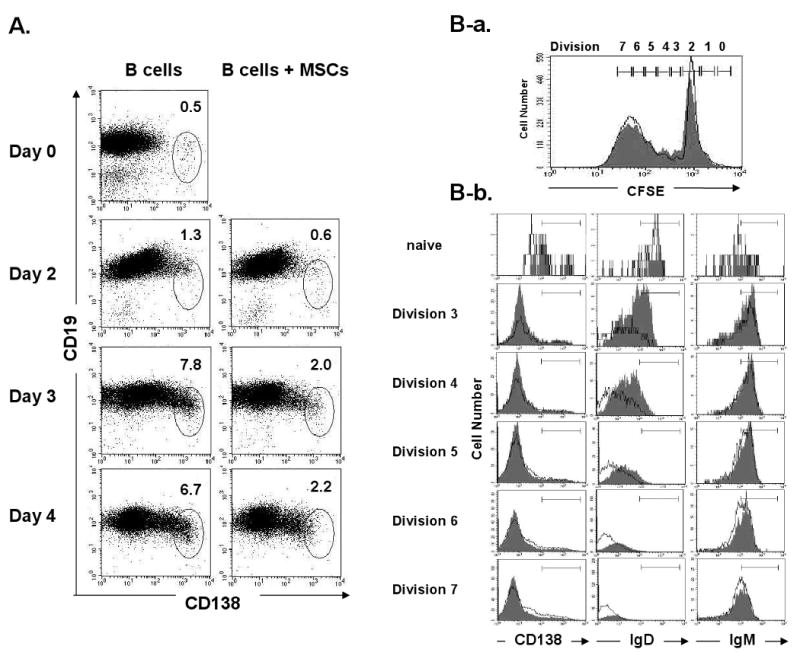
Materials and methods: MSCs were isolated from C57BL/6 bone marrow and expanded in culture. Splenic B cells were purified using anti-CD43 antibody and immunomagnetic beads. B cells and MSCs were cocultured in separate compartments in a transwell system. For B-cell stimulation, lipopolysaccharide was used in vitro and T-dependent and T-independent antigens were used in vivo.

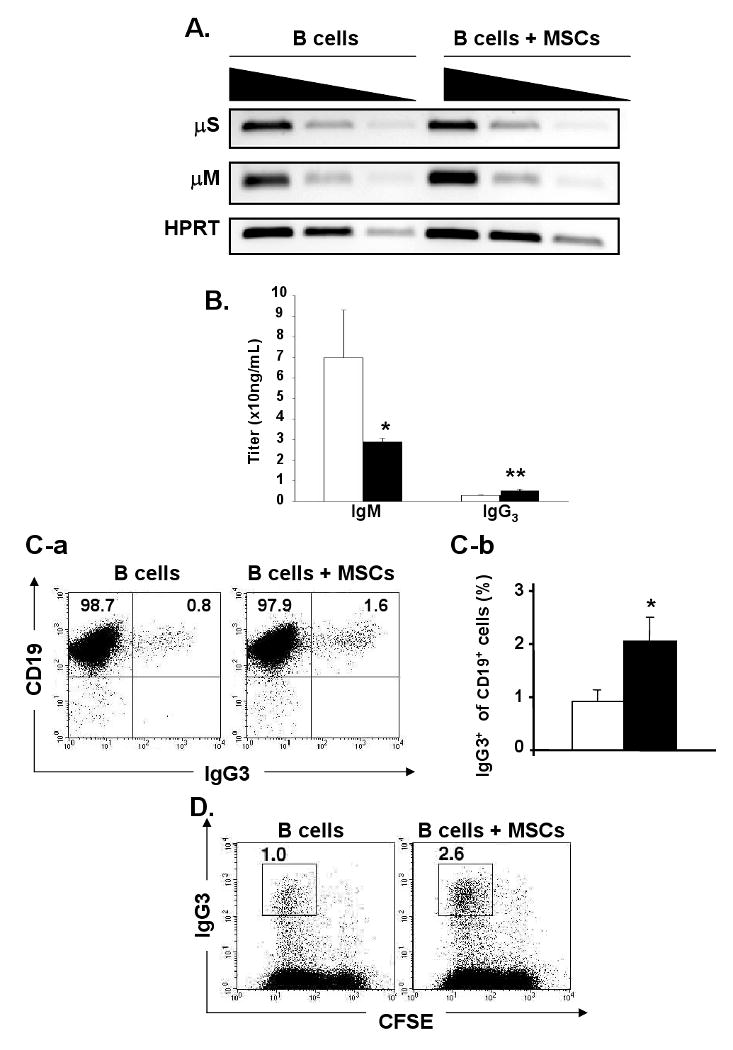
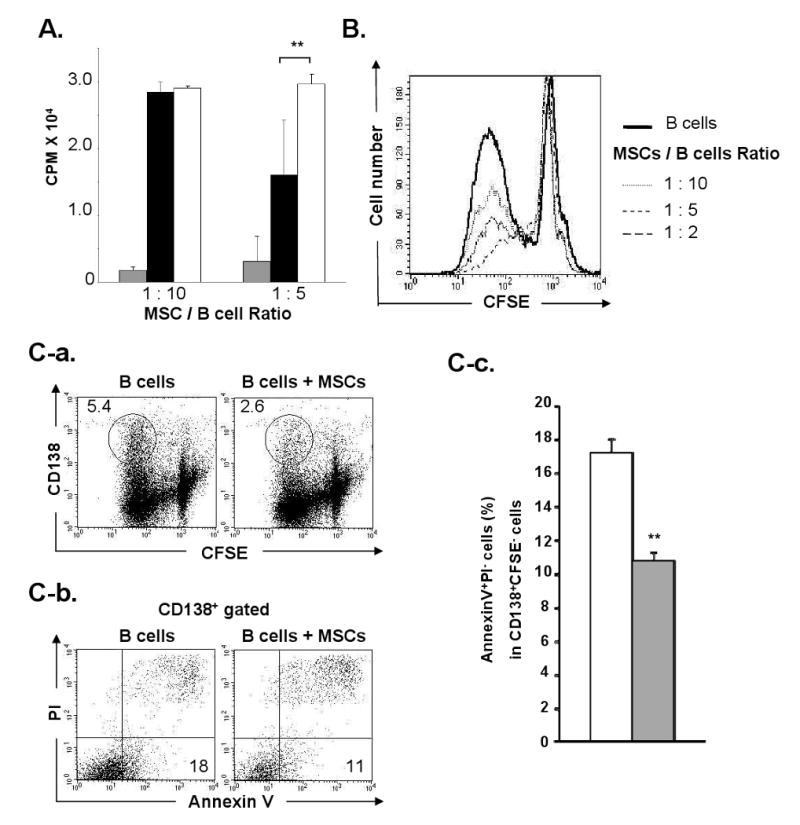
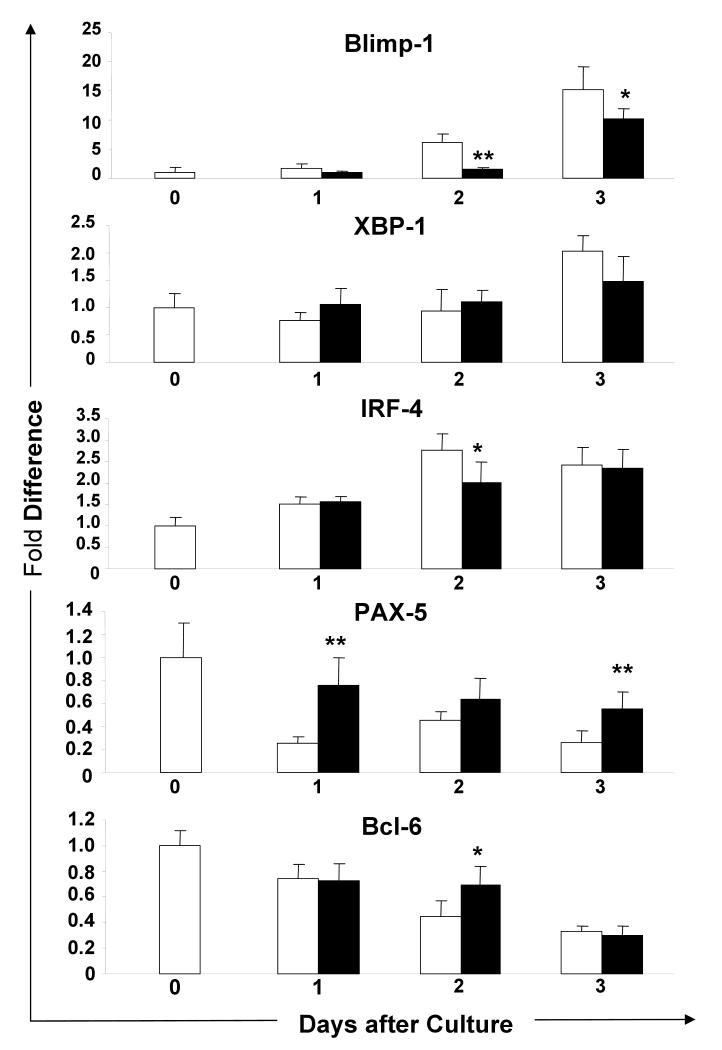
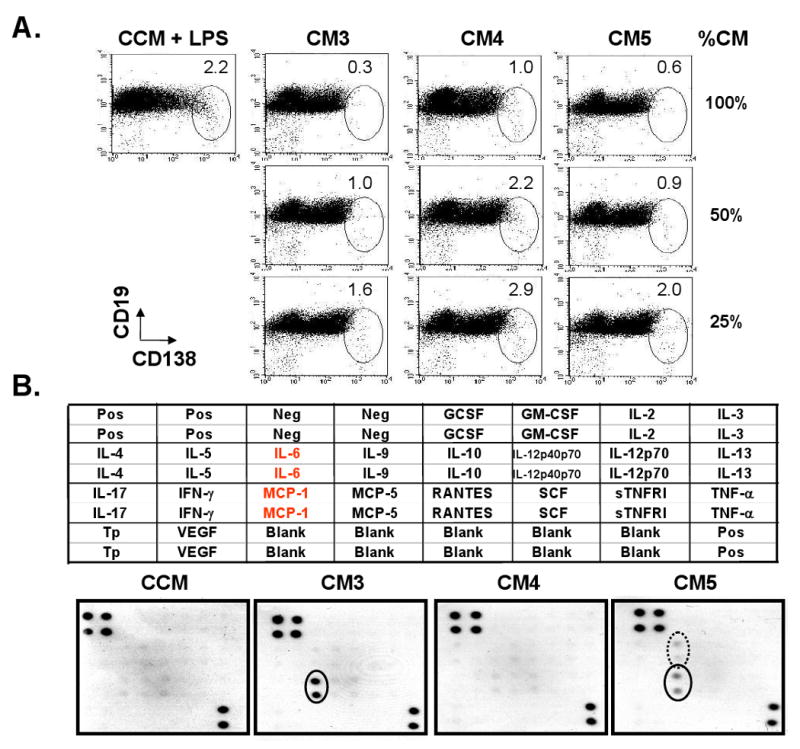
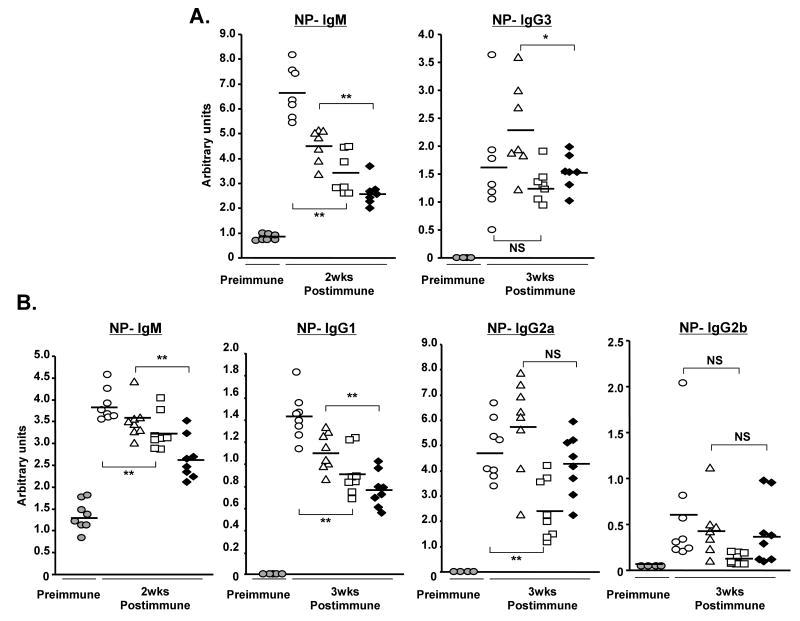
Results: In MSC cocultures, lipopolysaccharide-stimulated B-cell proliferation was suppressed, CD138(+) cell percentage decreased, and the number of apoptotic CD138(+) cells decreased. In the B/MSC coculture, the IgM(+) cell percentage was higher and the IgM amount released in the medium was lower than in the control. The B-lymphocyte-induced maturation protein-1 messenger RNA expression in the coculture was suppressed throughout the 3-day culture period. Conditioned media derived from MSC cultures prevented terminal differentiation of B cells in vitro and significantly suppressed the antigen-specific immunoglobulin M and immunoglobulin G1 secretion in mice immunized with T-cell-independent as well as T-cell-dependent antigens in vivo.

Conclusion: Results indicate that humoral factor(s) released by MSCs exert a suppressive effect on the B-cell terminal differentiation. Suppression may be mediated through inhibition of B-lymphocyte-induced maturation protein-1 expression, but the nature of the factor(s) is yet to be determined.


Figures

FIGURE 1
FIGURE 1
Characteristics of MSCs isolated from mouse bone marrow and expanded in culture: (A) MSCs were spindle-shape in monolayer culture (A-a, 100×), differentiated into adipocytes (A-b, Oil Red O staining, 200×) and osteocytes (A-c, alkaline phosphatase staining, 40×); (B) FACS analysis of MSCs using hematopoietic and immunophenotypic markers. Shaded histograms represent cells stained with a specific Ab and open histograms represent un-stained control cells.
FIGURE 2
FIGURE 2
MSCs inhibit B cell terminal differentiation: (A) CD138 expression was analyzed daily for 4 days by FACS on BALB/c B cells co-cultured with C57BL/6 MSCs (1: 10 ratio) in separate compartments in the transwell system; (B-a) Cell division of the CFSE-labeled B cells cultured with or without MSCs was analyzed by FACS on day 3; (B-b) Expression of IgM, IgD, and CD138 on the co-cultured (filled histograms) and control (open histograms) B cells was analyzed by FACS (Representative of three independent experiments).
FIGURE 3
FIGURE 3
MSCs selectively suppress LPS-stimulated B cell differentiation into IgM-forming cells and augment IgG3 expression: (A) mRNA was extracted on day 3 from the B cells cultured with or without MSCs. The expression of μM and μS mRNA was analyzed by semi-quantitative RT-PCR. Four-fold dilution series of the cDNA were used as input material for the PCR with primers specific for μM, μS, or HPRT as a reference and HPRT mRNA as an internal control for the amount of mRNAs (representative of n=2); (B) Titers of IgM and IgG3 were measured by ELISA in the supernatant of B cells cultured alone (open bar) or co-cultured with MSCs (solid bar) for 3 days. (Titers are shown by mean ± SD, n=3; *, p < 0.05; **, p < 0.01); (C) MSCs and CFSE-labeled B cells (1: 10 ratio) were co-cultured in the presence of LPS. (C-a) The numbers indicate IgG3-CD19+ and IgG3+CD19+ fractions on day 3; (C-b) The percentage of surface IgG3+ cells in CD19+ cells in B cells cultured alone (open bar) or with MSCs (solid bar) (n=5; **, p < 0.01); (D) The percentages of CFSE-CD138+ cells were determined on day 3 by FACS and shown in each square (representative of n=5).
FIGURE 4
FIGURE 4
MSCs suppress B cell proliferation, but do not induce plasma cell apoptosis: (A) 3H-thymidine uptake on day 2. B cells with MSCs at 1: 10 or 1: 5 ratio (solid bar), B cells cultured alone (open bar), and MSC alone (shaded bar) were cultured in the presence of LPS (cpm; mean ± SD, n=3); (B) MSCs and CFSE-labeled B cells were cultured at three different ratios (1: 10, 1: 5, and 1: 2) in transwells in the presence of LPS using B cells alone as controls. Histograms show the B cell division on day 3; (C) MSCs and CFSE-labeled B cells were co-cultured (1: 10) in the presence of LPS. (C-a) The number in each oval indicates the percentage of CFSE-CD138+ cells on day 3; (C-b) The numbers at low-right corners indicate the percentage of Annexin V+PI- cells in the CD138+ population in B/MSC and B alone cultures; (C-c) The shaded bar shows the percentage of Annexin V+PI- cells in CD138+CFSE- cells in B/MSC cultures (10: 1) and the open bar shows that in the B cell alone cultures (mean ± SD, triplicate tests of n=4; **, p< 0.01).
FIGURE 5
FIGURE 5
Blimp-1 expression is suppressed in B cells co-cultured with MSCs: mRNA was extracted from the B cells cultured alone or with MSCs in the presence of LPS in transwells for 3 days. The expression levels of Blimp-1, XBP-1, IRF-4, PAX-5, and Bcl-6 mRNA were analyzed by RT-PCR. The results were calculated by the comparative threshold cycle (Ct) method, with the Ct for the β-actin used to normalize the results. Expression of each gene was calculated with the endogenous level of the corresponding gene in untreated B cells defined as 1. Each of X-axis indicates the days of culture. Solid and open bars show results of B/MSC cell co-cultures and B cell alone, respectively (mean ± SD of 5 mRNA samples from two independent experiments; *, p < 0.05; **, p < 0.01).
FIGURE 6
FIGURE 6
MSCs prevent B cell differentiation into plasma cells by releasing humoral factor(s): (A) 106 B cells were cultured with 3 different concentrations (100, 50 or 25%) of CM3, CM4 or CM5 in 24-well plates for 3 days. CMs containing LPS were diluted with LPS-containing CCM, and those without LPS were diluted with CCM. B cells cultured with CCM containing LPS were used as controls. The numbers in each oval indicate the percentages of CD138+ CD19+/- cell fractions (n=3); (B) The presence of cytokines/chemokines in CM3, CM4, and CM5 was screened using the RayBio Mouse Cytokine Array I. The layout of the array is shown on the top. The protein array was incubated separately with test CM and CCM as a control. The results are shown at the bottom. Solid dots indicate the signal for MCP-1 and the circled dots indicates the signal for IL-6. (Pos: positive control; Neg: negative control; Tp: thrombopoietin). Spot intensity relative to the positive and negative control offers an indication of the relative amount of chemokines/cytokines present in the CM.
FIGURE 7
FIGURE 7
Antigen-specific Ig secretion is suppressed in the immunized mice treated with CM, a culture supernatant obtained from C57BL/6 MSCs cultures: (A) CM or control PBS was injected i.p. on days 0, 2, and 4 into BALB/c mice immunized on day 0 with 50 μg NP12-Ficoll (T-dependent Ag). Serum samples were analyzed for NP-specific IgM on days 0 and 14, and IgG3 on days 0 and 21; (B) CM or PBS was injected i.p. on days 2, 4, and 6 into BALB/c mice immunized with 50 μg alum-precipitated NP19-KLH (T-independent Ag). Serum samples were analyzed for NP-specific IgM on days 0 and 14, and IgG1, IgG2a, and IgG2b Abs on days 0 and 21. Ab titers were shown as arbitrary units by ELISA. Shaded circles, open circles, triangles, squares, or black diamonds represent pre-immune, PBS, CM1, CM2, or CM3, respectively (n = 7 for fig. 7A; n = 8 for fig. 7B; NS, not significant; *, p < 0.05; **, p < 0.01).

References

    1. Dorshkind K. Regulation of hemopoiesis by bone marrow stromal cells and their products. Annu Rev Immunol. 1990;8:111–137. - PubMed
    1. Pittenger MF, Mackay AM, Beck SC, et al. Multilineage potential of adult human mesenchymal stem cells. Science. 1999;284:143–147. - PubMed
    1. Jiang Y, Jahagirdar BN, Reinhardt RL, et al. Pluripotency of mesenchymal stem cells derived from adult marrow. Nature. 2002;418:41–49. - PubMed
    1. Bianco P, Robey PG. Stem cells in tissue engineering. Nature. 2001;414:118–121. - PubMed
    1. Asahara T, Kalka C, Isner JM. Stem cell therapy and gene transfer for regeneration. Gene ther. 2000;7:451–457. - PubMed

Publication types

MeSH terms