. 2009 Apr 16;62(1):123-34.
doi: 10.1016/j.neuron.2009.02.018.

Accurate sound localization in reverberant environments is mediated by robust encoding of spatial cues in the auditory midbrain

Affiliations

Accurate sound localization in reverberant environments is mediated by robust encoding of spatial cues in the auditory midbrain

Sasha Devore et al. Neuron. .

Abstract

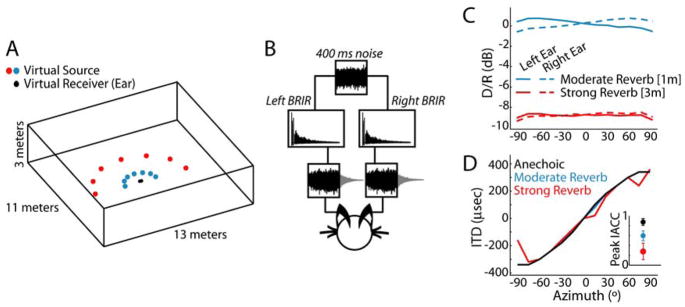
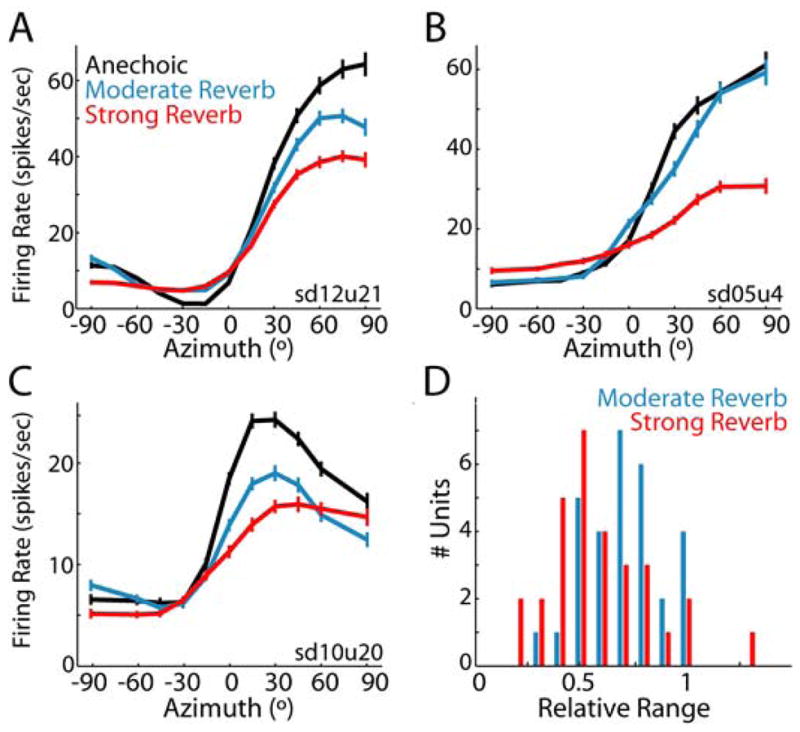
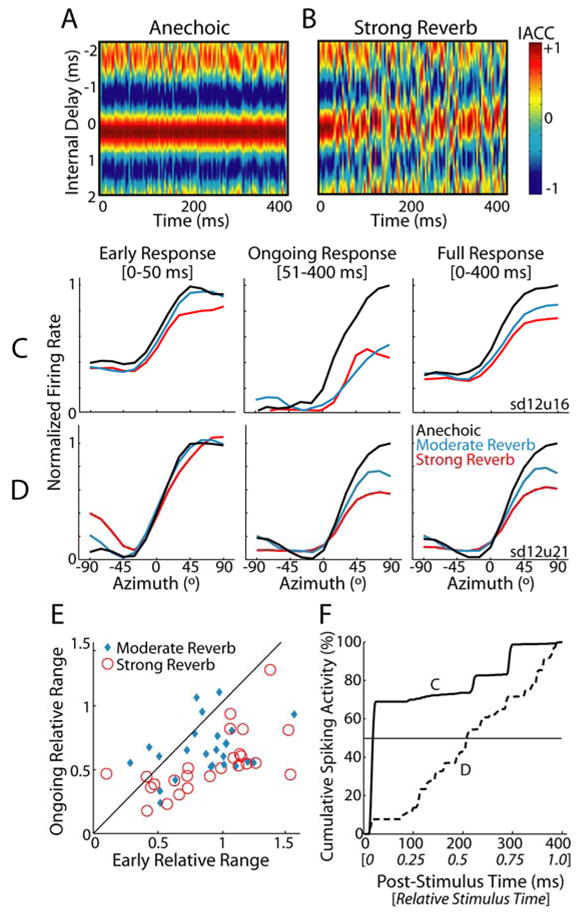
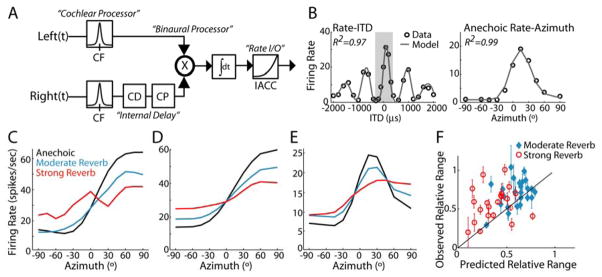
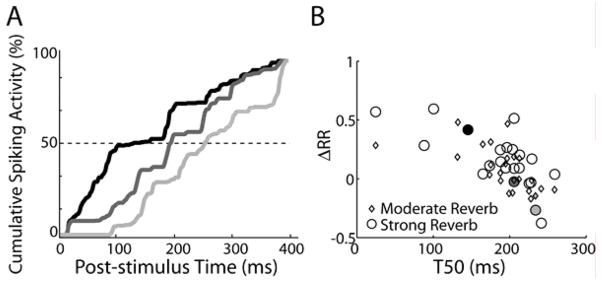
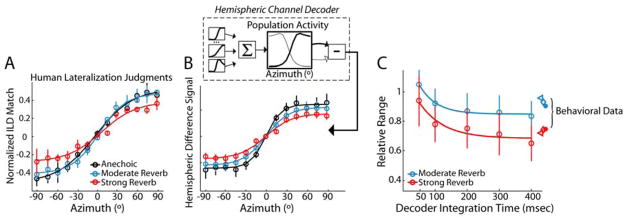
In reverberant environments, acoustic reflections interfere with the direct sound arriving at a listener's ears, distorting the spatial cues for sound localization. Yet, human listeners have little difficulty localizing sounds in most settings. Because reverberant energy builds up over time, the source location is represented relatively faithfully during the early portion of a sound, but this representation becomes increasingly degraded later in the stimulus. We show that the directional sensitivity of single neurons in the auditory midbrain of anesthetized cats follows a similar time course, although onset dominance in temporal response patterns results in more robust directional sensitivity than expected, suggesting a simple mechanism for improving directional sensitivity in reverberation. In parallel behavioral experiments, we demonstrate that human lateralization judgments are consistent with predictions from a population rate model decoding the observed midbrain responses, suggesting a subcortical origin for robust sound localization in reverberant environments.


Figures

Figure 1
Figure 1. Properties of the virtual auditory space simulations
A, Geometry of the virtual auditory environment. Reverberant binaural room impulse responses (BRIR) were simulated at two distances between source and receiver (1m and 3m). Anechoic (i.e., “no reverb”) BRIR were created by time-windowing the direct wavefront from the 1m reverberant BRIR. B, To simulate a sound source at a given azimuth, a reproducible 400-ms broadband noise burst is convolved with the left and right BRIR and presented to the experimental subject over headphones. C, Direct to reverberant energy ratio (D/R) vs. azimuth for reverberant BRIRs. D, Broadband ITD vs. azimuth for each room condition, estimated as the time delay corresponding to the peak normalized interaural correlation coefficient (IACC). Inset, Peak IACC for each room condition. Error bars represent ±1 std across azimuths.
Figure 2
Figure 2. Reverberation causes compression of neural rate-azimuth curves
Anechoic and reverberant rate-azimuth curves (mean ± 1 standard error) for three IC neurons with CFs of A, 817 Hz, B, 569 Hz, C, 1196 Hz. D, Population histogram of relative range for each D/R (moderate reverb: n=30; strong reverb, n=30).
Figure 3
Figure 3. Temporal dynamics of directional sensitivity in reverberation
A, Short-term IACC across time for the 45° anechoic virtual space stimulus; hot colors indicate high correlation. Ear-input signals were simulated as in Fig. 1B and subsequently bandpass filtered (4th-order Gammatone filter centered at 1000 Hz) to simulate peripheral auditory processing. Short-term IACC was computed using a sliding 4-ms window. B, Short-term IACC for the 45° strong reverb virtual space stimulus. C,D Rate-azimuth curves for two IC neurons computed using the early (0–50 msec), ongoing (51–400 msec), and full (0–400 msec) neural responses. To facilitate comparison across time periods, firing rates have been normalized to the maximum anechoic firing rate, separately for each time period. Unit CFs are C, 747 Hz and D, 817 Hz. E, Ongoing vs. early relative range for IC neuron population. Solid line indicates identity i.e., y=x. F, Average cumulative peristimulus time histograms (cPSTHs) for the two neurons in panels C (solid line) and D (dashed line).
Figure 4
Figure 4. Average effective IACC poorly predicts directional sensitivity in reverberation
A, Block diagram of the cross-correlation model, after Hancock and Delgutte (2004). Left and right ear-input signals are bandpass filtered to simulate cochlear processing. Right-ear signal is internally delayed through a combination of pure time delay (CD) and phase shift (CP), and the resulting IACC is converted to firing rate using a power-law nonlinearity. B, Example model fits to the rate-ITD (left) and anechoic rate-azimuth (right) data for one IC unit (CF=1312 Hz). The shaded region in the left panel delineates the range of ITDs corresponding to ±90° in the right panel. C–E, Model predictions of rate-azimuth curves for three IC neurons (same units as in Fig. 2A–C). For each neuron, model parameters were adjusted to minimize least-squared error between observed and predicted rate-ITD and anechoic rate-azimuth curves and subsequently fixed to generate predictions of reverberant rate-azimuth curves. F, Observed vs. predicted relative range across the IC neuron population. Solid line indicates identity i.e., y=x. Error bars represent bootstrap estimates of ±1 std. of relative range for observed responses.
Figure 5
Figure 5. Onset dominance is related to robust directional sensitivity in reverberation
A, cPSTHs for three IC neurons with CFs of 150 Hz (black), 741 Hz (dark gray), and 1551 Hz (light gray). T50 is defined as the time at which the cPSTH reaches 50% of its final value (intersection of cPSTH with dashed line). B, Model prediction error (ΔRR) vs. T50 across the IC neuron population, where positive ΔRR indicate robustness to reverberation. The two metrics are inversely correlated (moderate reverb: p=0.007; strong reverb: p=0.003). Shaded symbols correspond to the units shown in A.
Figure 6
Figure 6. Hemispheric decoding of IC neural responses accounts for lateralization behavior of human listeners
A, Human lateralization judgments. Across-subject (n=3) mean (± 1 std) estimate of lateral position (i.e., normalized ILD-match) vs. stimulus azimuth. B, Upper panel, Schematic of the population decoding model (see text for description). Lower panel, Hemispheric difference signal vs. azimuth. Error bars indicate bootstrap estimates of ±1 std. C, Comparison of decoder and perceptual compression. Relative range of hemispheric difference signal (open circles) vs. the time interval over which firing rate is integrated in the hemispheric decoding model; solid lines indicate fits by decaying exponential. Error bars represent bootstrap estimates of ± 1 std. Relative range of human behavioral responses is plotted at the right edge of the panel (different symbols represent individual subjects).

Comment in

References

    1. Adams JC. Ascending projections to the inferior colliculus. J Comp Neurol. 1979;183:519–538. - PubMed
    1. Aitkin LM, Gates GR, Phillips SC. Responses of Neurons in the Inferior Colliculus to Variations in Sound-Source Azimuth. Journal of Neurophysiology. 1984;52:1–17. - PubMed
    1. Albeck Y, Konishi M. Responses of neurons in the auditory pathway of the barn owl to partially correlated binaural signals. Journal of Neurophysiology. 1995;74:1689–1700. - PubMed
    1. Allen JB, Berkley DA. Image method for efficiently simulating small-room acoustics. J Acoust Soc Am. 1979;65:943–950.
    1. Beranek L. Concert Halls and Opera Houses. 2. New York: Springer-Verlag; 2004.

Publication types

LinkOut - more resources