. 2009 Oct;47(4):426-35.
doi: 10.1016/j.yjmcc.2009.04.006. Epub 2009 Apr 17.

Myocyte remodeling in response to hypertrophic stimuli requires nucleocytoplasmic shuttling of muscle LIM protein

Affiliations

Myocyte remodeling in response to hypertrophic stimuli requires nucleocytoplasmic shuttling of muscle LIM protein

Samuel Y Boateng et al. J Mol Cell Cardiol. 2009 Oct.

Abstract

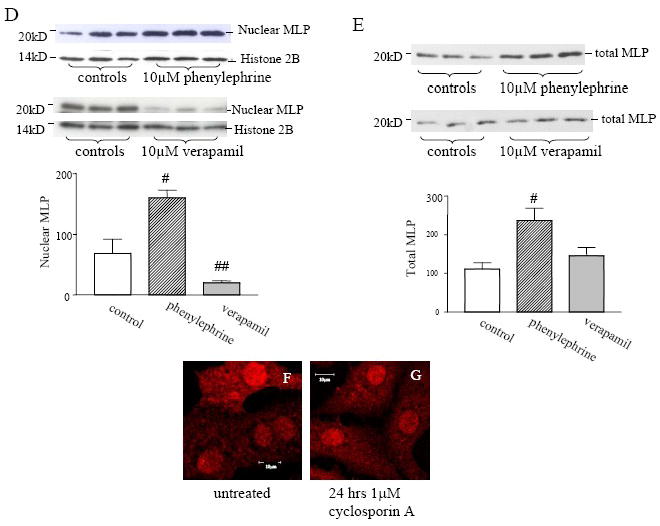
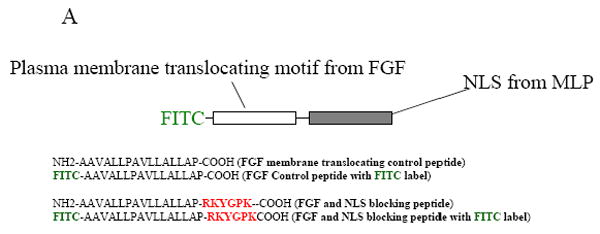
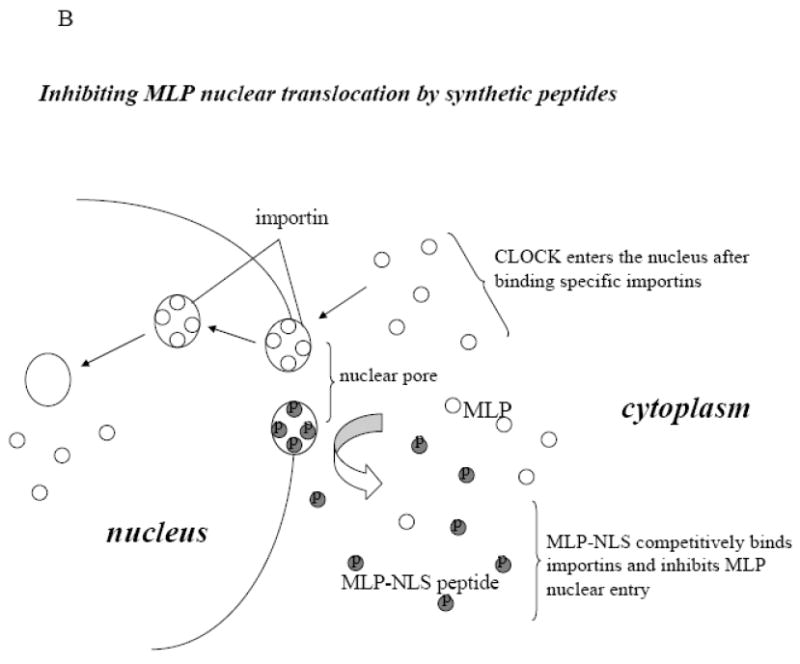
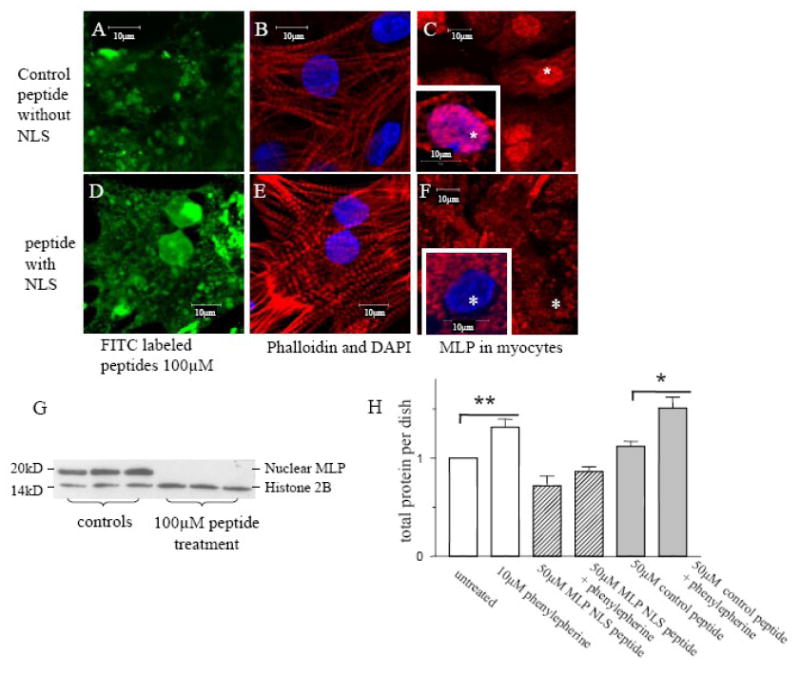
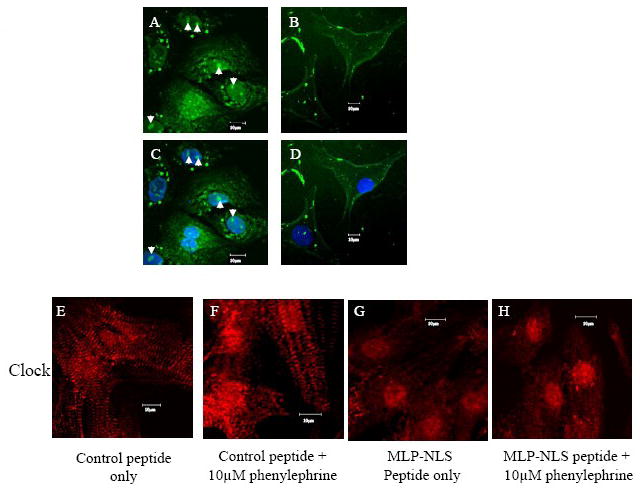
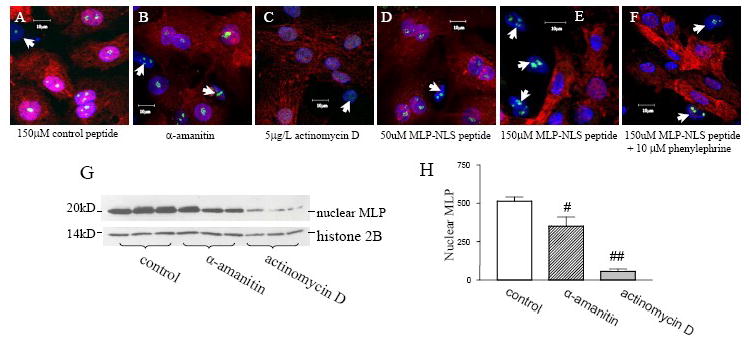
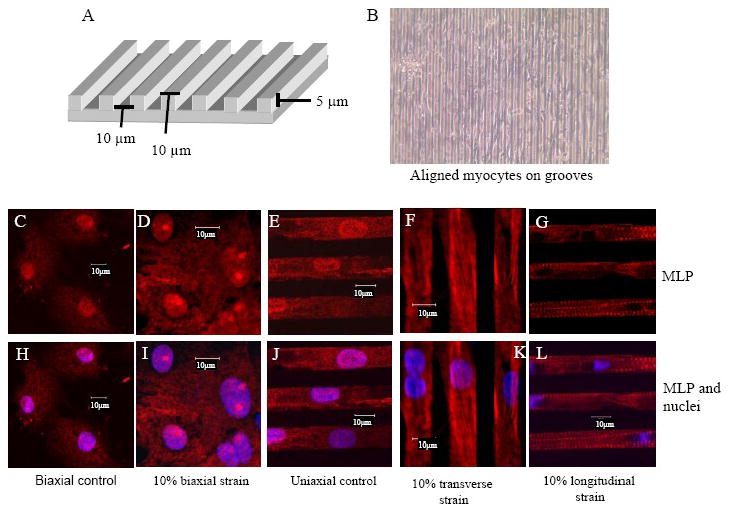
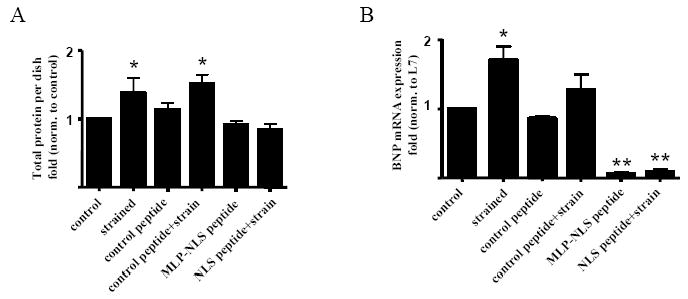
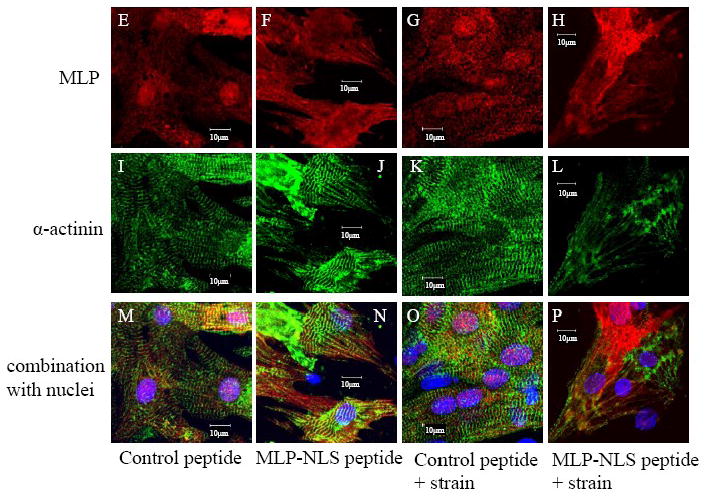
CSRP3 or muscle LIM protein (MLP) is a nucleocytoplasmic shuttling protein and a mechanosensor in cardiac myocytes. MLP regulation and function was studied in cultured neonatal rat myocytes treated with pharmacological or mechanical stimuli. Either verapamil or BDM decreased nuclear MLP while phenylephrine and cyclic strain increased it. These results suggest that myocyte contractility regulates MLP subcellular localization. When RNA polymerase II was inhibited with alpha-amanitin, nuclear MLP was reduced by 30%. However, when both RNA polymerase I and II were inhibited with actinomycin D, there was a 90% decrease in nuclear MLP suggesting that its nuclear translocation is regulated by both nuclear and nucleolar transcriptional activity. Using cell permeable synthetic peptides containing the putative nuclear localization signal (NLS) of MLP, nuclear import of the protein in cultured rat neonatal myocytes was inhibited. The NLS of MLP also localizes to the nucleolus. Inhibition of nuclear translocation prevented the increased protein accumulation in response to phenylephrine. Furthermore, cyclic strain of myocytes after prior NLS treatment to remove nuclear MLP resulted in disarrayed sarcomeres. Increased protein synthesis and brain natriuretic peptide expression were also prevented suggesting that MLP is required for remodeling of the myofilaments and gene expression. These findings suggest that nucleocytoplasmic shuttling MLP plays an important role in the regulation of the myocyte remodeling and hypertrophy and is required for adaptation to hypertrophic stimuli.


Figures

Figure 1
Figure 1
Regulation of MLP subcellular localization in cultured neonatal rat myocytes. (A, B and C) Neonatal rat ventricular myocytes MLP (red) and (A’, B’ and C’) nuclei with DAPI (blue). Myocytes are (A) unstrained, or treated for 24 hours with (B) 10μM verapamil or (C) with 10μM phenylephrine. (D) Western blot of nuclear fractions myocytes compared to untreated control for MLP and normalized to the nuclear protein histone 2B. 24h phenylephrine treatment increased nuclear MLP (p<0.05 n=3) but verapamil decreased it (p<0.01 n=3). (E) Western blot of total MLP from myocytes treated with either verapamil (not significant) or phenylephrine (p<0.05, n=3). Panels F and G show cultured myocytes with and without 1μM treatment of the calcineurin inhibitor cyclosporin A for 24 hours. There is strong nuclear staining for MLP in both control and treated cells.
Figure 1
Figure 1
Regulation of MLP subcellular localization in cultured neonatal rat myocytes. (A, B and C) Neonatal rat ventricular myocytes MLP (red) and (A’, B’ and C’) nuclei with DAPI (blue). Myocytes are (A) unstrained, or treated for 24 hours with (B) 10μM verapamil or (C) with 10μM phenylephrine. (D) Western blot of nuclear fractions myocytes compared to untreated control for MLP and normalized to the nuclear protein histone 2B. 24h phenylephrine treatment increased nuclear MLP (p<0.05 n=3) but verapamil decreased it (p<0.01 n=3). (E) Western blot of total MLP from myocytes treated with either verapamil (not significant) or phenylephrine (p<0.05, n=3). Panels F and G show cultured myocytes with and without 1μM treatment of the calcineurin inhibitor cyclosporin A for 24 hours. There is strong nuclear staining for MLP in both control and treated cells.
Figure 2
Figure 2
Inhibition of MLP nuclear translocation by synthetic peptides. (A) Diagram of sequences for the membrane translocating motif from FGF (16 amino acids) with or without the FITC label (green) and attached the putative NLS sequence of MLP (6 amino acid) (red). (B) Diagram showing how cell permeable peptides can competitively inhibit the nuclear translocation of endogenous MLP. FITC-labeled MLP-NLS containing synthetic peptide (dark circles) and endogenous MLP (open circles).
Figure 2
Figure 2
Inhibition of MLP nuclear translocation by synthetic peptides. (A) Diagram of sequences for the membrane translocating motif from FGF (16 amino acids) with or without the FITC label (green) and attached the putative NLS sequence of MLP (6 amino acid) (red). (B) Diagram showing how cell permeable peptides can competitively inhibit the nuclear translocation of endogenous MLP. FITC-labeled MLP-NLS containing synthetic peptide (dark circles) and endogenous MLP (open circles).
Figure 3
Figure 3
Inhibition of MLP nuclear translocation by synthetic peptides. Myocytes treated for 24 h with 100μM FITC labeled membrane translocating peptide (green) (A) without MLP-NLS (control) or (D) with the MLP-NLS. (B, E) Myocytes stained for actin phalloidin (red). (C) Myocytes without and (F) with MLP-NLS treatment stained for MLP (red). (E, F) Nuclei stained by DAPI (blue). (G) Western blot of nuclear extracts from myocytes treated with the control or MLP NLS peptides and probed for MLP and the nuclear protein histone 2B. (H) Total protein from myocyte cultures with and without 10μM phenylephrine treatment and 50μM peptide. Phenylephrine significantly increases total protein in control myocytes (**p<0.01 n=6 cultures) and in the presence of the control peptide (*p<0.05 n=6 cultures).
Figure 4
Figure 4
Specificity of the MLP-NLS peptide. (A) Myocytes treated for 24 h with 100μM of MLP-NLS-FITC peptide (green) seen in the cytoplasm, nucleus and nucleolus (arrows). (B) Fibroblasts treated for 48 h with 100μM of the MLP-NLS-FITC peptide (green) only present in the cytoplasm. (C, D) DAPI staining for nuclei (blue). Effect of MLP-NLS on the circadian protein Clock (immunostained red), (E) control peptide only or (F) with 10μm phenylephrine treatment; (G) MLP-NLS peptide only or (H) 10μm phenylephrine treatment. Clock protein translocates to the nucleus with phenylephrine treatment in both absence and presence of MLP blocking peptide.
Figure 5
Figure 5
Transcriptional activity and MLP nuclear translocation. (A-F) Cardiac myocytes and fibroblasts treated with synthetic peptides and inhibitors of RNA polymerase I or both RNA polymerase I and polymerase II dependent transcription: (A) 150μM control peptide for 48h, (B) 1μM of the RNA polymerase II inhibitor α-amanitin for 24 h, (C) 12.5mg/L actinomycin D for 10 hours, a concentration which inhibits both polymerase I in addition to RNA polymerase II, (D) 50μM MLP-NLS peptide for 48h, (E) 150μM of MLP-NLS peptide for 48 h and (F) 150μM of MLP-NLS peptide and 10μM phenylephrine for 48 h. Cells were stained for MLP (red) and nuclei with DAPI (blue). Active nucleolar transcription is detected by presence of fibrillarin (green) and found only in fibroblasts (white arrows) that do not express MLP. (G) Western blot of nuclear MLP from myocytes treated with either α-amanitin or actinomycin D with histone 2B as a nuclear loading control. (H) Quantification of MLP from nuclear fractions after treatment with α-amanitin (# vs. control p<0.05 n=3) and actinomycin D (## vs. control p<0.01 n=3).
Figure 6
Figure 6
MLP nuclear translocation and directional strain. (A) Diagram of the microtopography silicone surface with groove dimensions of 5μm height,10 μm width in a parallel array pattern with 10 μm spacing between them. (B) Phase image of aligned myocytes cultured on the grooved silicon membranes. (C) Unstrained myocytes cultured on a flat silicone membrane with nuclear MLP (red). (D) Myocyte with 10% cyclic biaxial strain, 1Hz, 48h have punctate nuclear MLP. (E) Unstrained myocytes on grooved surface with nuclear MLP. (F) Myocytes after 10% cyclic transverse stretch, 1Hz for 48h have decreased nuclear MLP but have longitudinal myofibrillar streaks. (G) Myocytes after 10% cyclic longitudinal strain, 1Hz for 48h decreased nuclear MLP but with striations of sarcomeres. (C-G) MLP (red), (H-L) MLP and DAPI (blue).
Figure 7
Figure 7
Cyclic strain and nuclear MLP in cultured neonatal myocytes. (A) Total protein from cyclically strained myocytes increased significantly in untreated cells and control peptide treated cells. *Control vs. strained, p<0.05. *Control peptide vs. NLS peptide, p<0.01. *Control peptide+strain vs. NLS peptide + strain, p<0.01, n=5 separate cultures. There was no change following cyclic strain in the presence of MLP nuclear blockade. (B) BNP mRNA increased significantly in control myocytes but not in the MLP nuclear blocked group. *Control vs. strained, p<0.05. *Control peptide vs. control peptide+ strain p<0.05, n=5 separate cultures. Similar results were obtained when the expression of BNP was standardized to either GAPDH (data not shown). (C) Western blots quantified show S6 ribosomal protein expression increased significantly following strain in all groups. *Control vs. strained, p<0.05. *Control peptide vs. control peptide+ strain p<0.05, *NLS peptide vs. NLS peptide+ strain p<0.05, n=5 separate cultures. (D) Western blots quantified show α-actinin protein expression in the same treatment groups. Following treatment with the MLP NLS peptide α-actinin decreased significantly. These levels did not increase following cyclic strain. *Control vs. NLS peptide, p<0.05 and *Control vs. NLS peptide+ strain p<0.05, n=4 separate cultures. Images of myocytes treated for 48 hours with (E,I,M) 50μM control peptide, (F,J, N) 50μM MLP-NLS peptide, (G,K, O) control peptide and cyclically strained at 10% maximum strain, 1 Hz for 48 hours, and (H,L,P) 50μM MLP-NLS peptide and cyclically strained at 10% maximum strain, 1 Hz. (E-P) Cells immunostained for MLP (red), α-actinin (green) and nuclei with DAPI (blue).
Figure 7
Figure 7
Cyclic strain and nuclear MLP in cultured neonatal myocytes. (A) Total protein from cyclically strained myocytes increased significantly in untreated cells and control peptide treated cells. *Control vs. strained, p<0.05. *Control peptide vs. NLS peptide, p<0.01. *Control peptide+strain vs. NLS peptide + strain, p<0.01, n=5 separate cultures. There was no change following cyclic strain in the presence of MLP nuclear blockade. (B) BNP mRNA increased significantly in control myocytes but not in the MLP nuclear blocked group. *Control vs. strained, p<0.05. *Control peptide vs. control peptide+ strain p<0.05, n=5 separate cultures. Similar results were obtained when the expression of BNP was standardized to either GAPDH (data not shown). (C) Western blots quantified show S6 ribosomal protein expression increased significantly following strain in all groups. *Control vs. strained, p<0.05. *Control peptide vs. control peptide+ strain p<0.05, *NLS peptide vs. NLS peptide+ strain p<0.05, n=5 separate cultures. (D) Western blots quantified show α-actinin protein expression in the same treatment groups. Following treatment with the MLP NLS peptide α-actinin decreased significantly. These levels did not increase following cyclic strain. *Control vs. NLS peptide, p<0.05 and *Control vs. NLS peptide+ strain p<0.05, n=4 separate cultures. Images of myocytes treated for 48 hours with (E,I,M) 50μM control peptide, (F,J, N) 50μM MLP-NLS peptide, (G,K, O) control peptide and cyclically strained at 10% maximum strain, 1 Hz for 48 hours, and (H,L,P) 50μM MLP-NLS peptide and cyclically strained at 10% maximum strain, 1 Hz. (E-P) Cells immunostained for MLP (red), α-actinin (green) and nuclei with DAPI (blue).

References

    1. Benmerah A, Scott M, Poupon V, Marullo S. Nuclear functions for plasma membrane-associated proteins? Traffic. 2003;4(8):503–11. - PubMed
    1. Wixler V, Geerts D, Laplantine E, Westhoff D, Smyth N, Aumailley M, et al. The LIM-only protein DRAL/FHL2 binds to the cytoplasmic domain of several alpha and beta integrin chains and is recruited to adhesion complexes. Journal of Biological Chemistry. 2000;275(43):33669–78. - PubMed
    1. Hoshijima M. Mechanical stress-strain sensors embedded in cardiac cytoskeleton: Z disk, titin, and associated structures. Am J Physiol Heart Circ Physiol. 2006;290(4):H1313–25. - PMC - PubMed
    1. Boateng SY, Belin RJ, Geenen DL, Margulies KB, Martin JL, Hoshijima M, et al. Cardiac dysfunction and heart failure are associated with abnormalities in the subcellular distribution and amounts of oligomeric muscle LIM protein. American Journal of Physiology - Heart & Circulatory Physiology. 2007;292(1):H259–69. - PubMed
    1. Gehmlich K, Geier C, Milting H, Furst D, Ehler E. Back to square one: what do we know about the functions of Muscle LIM Protein in the heart? J Muscle Res Cell Motil. 2008 Dec 30; - PubMed

Publication types

MeSH terms