

The Relationship between intraocular pressure and progressive retinal nerve fiber layer loss in glaucoma
- PMID: 19376584
- PMCID: PMC2848169
- DOI: 10.1016/j.ophtha.2008.12.062
The Relationship between intraocular pressure and progressive retinal nerve fiber layer loss in glaucoma
Abstract
Purpose: To evaluate the relationship between intraocular pressure (IOP) and progressive retinal nerve fiber layer (RNFL) loss, as measured by scanning laser polarimetry with enhanced corneal compensation (GDx ECC), in a cohort of glaucoma patients and individuals suspected of having the disease followed over time.
Design: Observational cohort study.
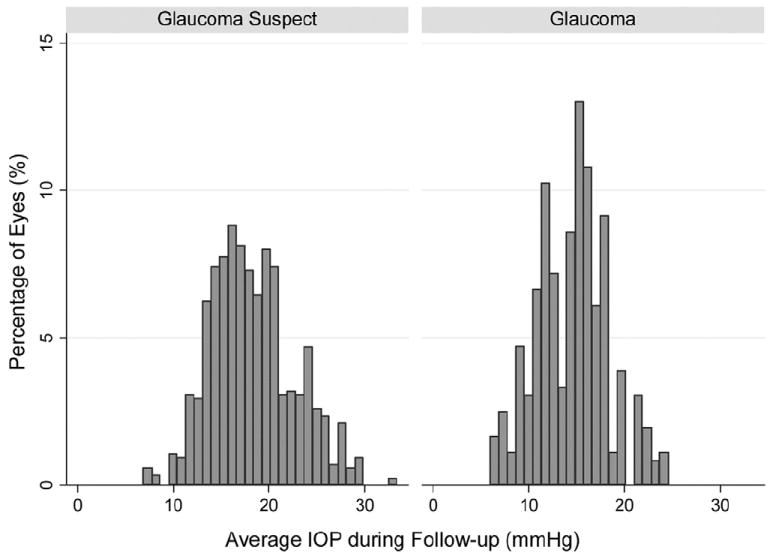
Participants: The study included 344 eyes of 204 patients recruited from the Diagnostic Innovations in Glaucoma Study (DIGS). There were 98 eyes (28%) with a diagnosis of glaucoma and 246 (72%) were considered glaucoma suspects at baseline.
Methods: Images were obtained annually with the GDx ECC scanning laser polarimeter, along with stereophotographs and SAP. The study included a total of 1211 GDx ECC visits with an average of 3.5 visits per eye. Progression was determined by the Guided Progression Analysis software for SAP and by masked assessment of stereophotographs performed by expert graders.
Main outcome measures: Random coefficient models were used to evaluate the relationship between IOP and RNFL thickness measurements over time in progressors and nonprogressors. Models were adjusted for baseline diagnosis and central corneal thickness.
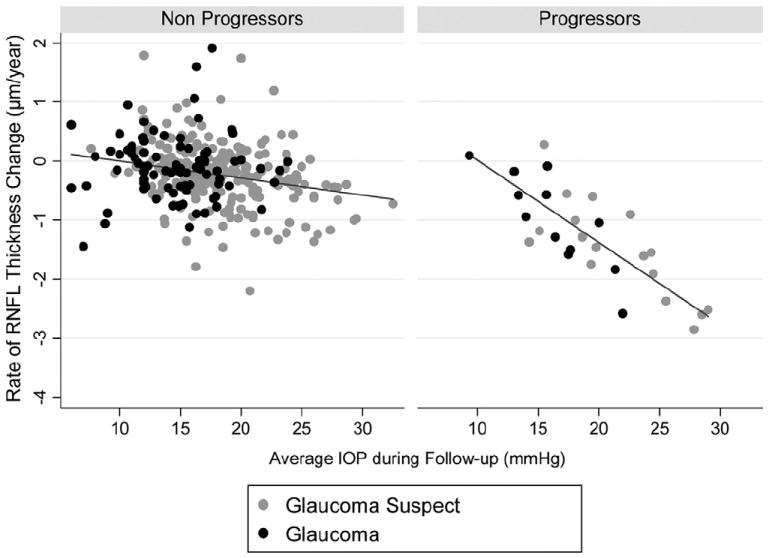
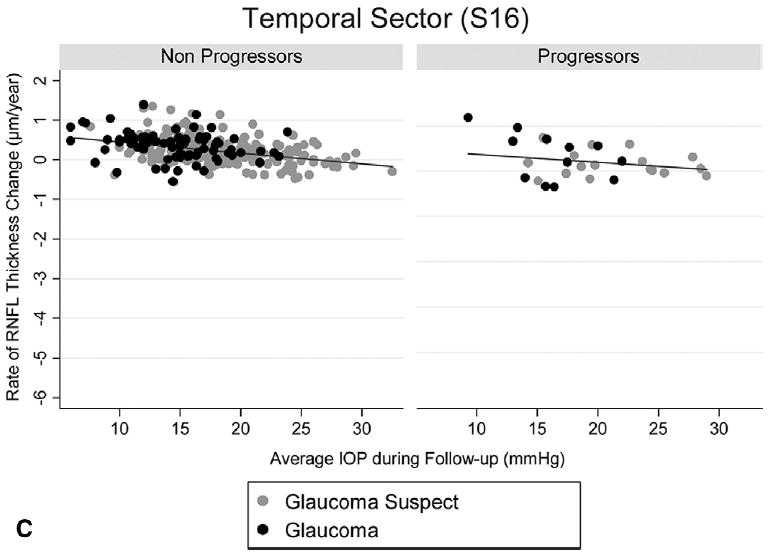
Results: For all 344 eyes, the overall rate of change for the GDx ECC average thickness at an average IOP of 17 mmHg was -0.25 microm per year (P = 0.002). Each 1-mmHg higher IOP was associated with an additional loss of 0.05 microm per year of RNFL (P = 0.001). Twenty-nine eyes (8%) showed progression on SAP and/or optic disc stereophotographs. These eyes had a significantly higher rate of RNFL change (-0.95 microm/year) than nonprogressors (-0.17 microm/year; P = 0.001). For progressors, each 1-mmHg higher IOP was associated with an additional loss of 0.13 microm per year of RNFL.
Conclusions: Higher levels of IOP during follow-up were significantly related to higher rates of progressive RNFL loss detected by the GDx ECC. These findings suggest that the GDx ECC may be helpful in monitoring progression and estimating rates of change in patients with glaucoma or suspected of having the disease. Also, they may contribute to a better understanding of the relationship between IOP and structural deterioration in glaucoma.
Financial disclosure(s): Proprietary or commercial disclosure may be found after the references.
Figures
Similar articles
-
Detection of progressive retinal nerve fiber layer loss in glaucoma using scanning laser polarimetry with variable corneal compensation.Invest Ophthalmol Vis Sci. 2009 Apr;50(4):1675-81. doi: 10.1167/iovs.08-2712. Epub 2008 Nov 21. Invest Ophthalmol Vis Sci. 2009. PMID: 19029038 Free PMC article.
-
Rates of progressive retinal nerve fiber layer loss in glaucoma measured by scanning laser polarimetry.Am J Ophthalmol. 2010 Jun;149(6):908-15. doi: 10.1016/j.ajo.2010.01.010. Epub 2010 Apr 8. Am J Ophthalmol. 2010. PMID: 20378095
-
Impact of atypical retardation patterns on detection of glaucoma progression using the GDx with variable corneal compensation.Am J Ophthalmol. 2009 Jul;148(1):155-63.e1. doi: 10.1016/j.ajo.2009.01.021. Epub 2009 Apr 17. Am J Ophthalmol. 2009. PMID: 19375062 Free PMC article.
-
Retinal nerve fiber layer analysis in the diagnosis of glaucoma.Curr Opin Ophthalmol. 2006 Apr;17(2):120-31. doi: 10.1097/01.icu.0000193079.55240.18. Curr Opin Ophthalmol. 2006. PMID: 16552246 Review.
-
The effects of hemodialysis on the eye.Indian J Ophthalmol. 2025 May 1;73(5):648-655. doi: 10.4103/IJO.IJO_1450_23. Epub 2025 Apr 24. Indian J Ophthalmol. 2025. PMID: 40272292 Free PMC article. Review.
Cited by
-
The rate of structural change: the confocal scanning laser ophthalmoscopy ancillary study to the ocular hypertension treatment study.Am J Ophthalmol. 2013 Jun;155(6):971-82. doi: 10.1016/j.ajo.2013.01.020. Epub 2013 Mar 14. Am J Ophthalmol. 2013. PMID: 23497845 Free PMC article. Clinical Trial.
-
How Does Weight Loss After Bariatric Surgery Impact the Ocular Parameters? A Review.Obes Surg. 2023 Jun;33(6):1916-1927. doi: 10.1007/s11695-023-06607-1. Epub 2023 Apr 27. Obes Surg. 2023. PMID: 37103665 Free PMC article. Review.
-
Assessment of Structural Glaucoma Progression.J Curr Glaucoma Pract. 2012 May-Aug;6(2):62-67. doi: 10.5005/jp-journals-10008-1108. Epub 2012 Aug 16. J Curr Glaucoma Pract. 2012. PMID: 28028348 Free PMC article.
-
Risk Factors for the Structural Progression of Myopic Glaucomatous Eyes with a History of Laser Refractive Surgery.J Clin Med. 2021 May 29;10(11):2408. doi: 10.3390/jcm10112408. J Clin Med. 2021. PMID: 34072378 Free PMC article.
-
Intraocular pressure correlation to progressive retinal nerve fiber layer loss in primary open angle glaucoma as measured by standard and modified goldmann applanation tonometers.BMC Ophthalmol. 2025 Apr 30;25(1):263. doi: 10.1186/s12886-025-04060-5. BMC Ophthalmol. 2025. PMID: 40307768 Free PMC article.
References
-
- Leske MC, Heijl A, Hyman L, et al. Predictors of long-term progression in the Early Manifest Glaucoma Trial. Ophthalmology. 2007;114:1965–72. - PubMed
-
- Miglior S, Zeyen T, Pfeiffer N, et al. Results of the European Glaucoma Prevention Study. Ophthalmology. 2005;112:366–75. - PubMed
-
- Kass MA, Heuer DK, Higginbotham EJ, et al. The Ocular Hypertension Treatment Study: a randomized trial determines that topical ocular hypotensive medication delays or prevents the onset of primary open-angle glaucoma. Arch Ophthalmol. 2002;120:701–13. - PubMed
-
- The Advanced Glaucoma Intervention Study (AGIS): 7. The relationship between control of intraocular pressure and visual field deterioration. The AGIS Investigators. Am J Ophthalmol. 2000;130:429–40. - PubMed
-
- Leske MC, Heijl A, Hussein M, et al. Factors for glaucoma progression and the effect of treatment: the Early Manifest Glaucoma Trial. Arch Ophthalmol. 2003;121:48–56. - PubMed
Publication types
MeSH terms
Grants and funding
LinkOut - more resources
Full Text Sources
Medical
Miscellaneous
