. 2009 Jun 19;284(25):16808-16821.
doi: 10.1074/jbc.M807723200. Epub 2009 Apr 17.

Mitochondrial dysfunction contributes to impaired insulin secretion in INS-1 cells with dominant-negative mutations of HNF-1alpha and in HNF-1alpha-deficient islets

Affiliations

Mitochondrial dysfunction contributes to impaired insulin secretion in INS-1 cells with dominant-negative mutations of HNF-1alpha and in HNF-1alpha-deficient islets

Rebecca L Pongratz et al. J Biol Chem. .

Abstract

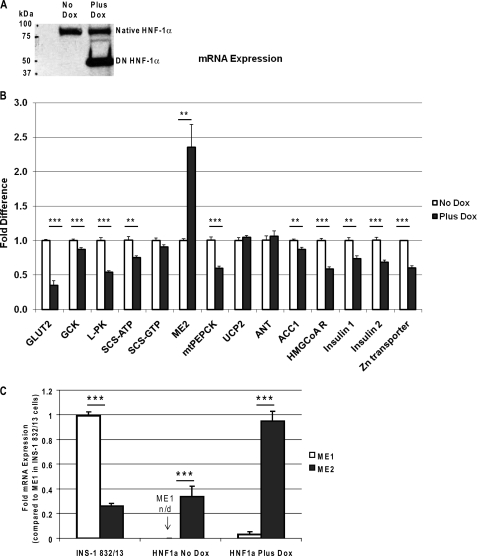
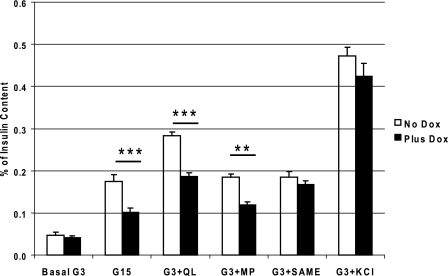
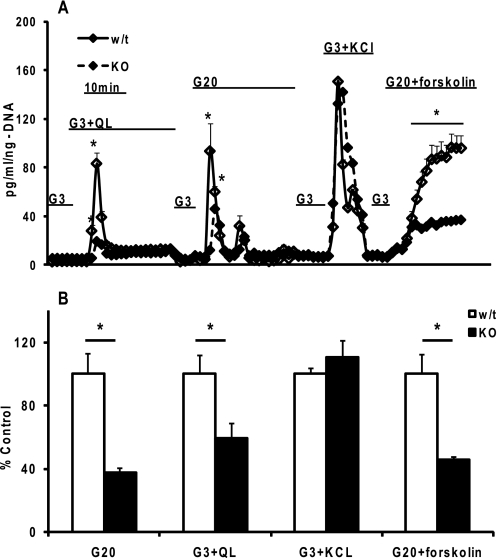
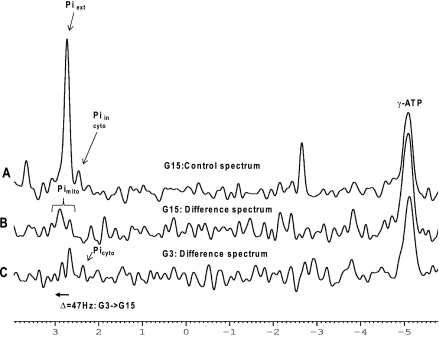
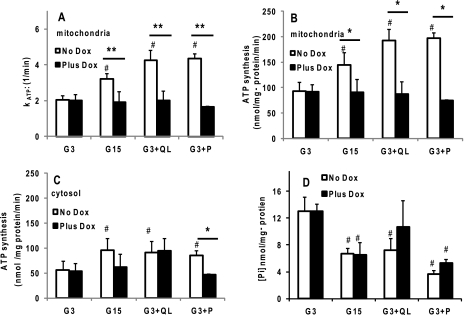
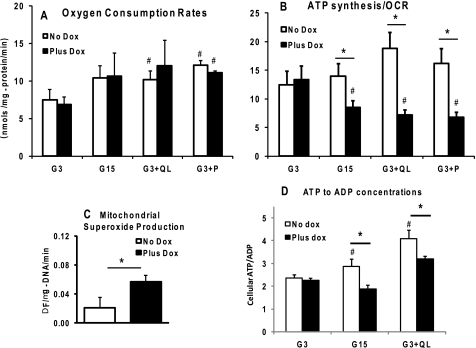
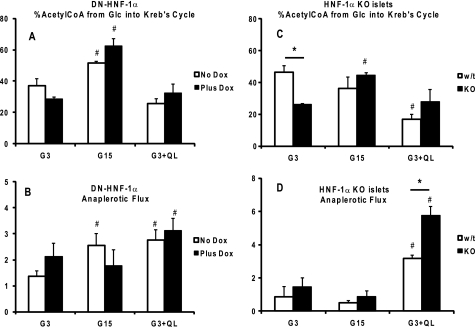
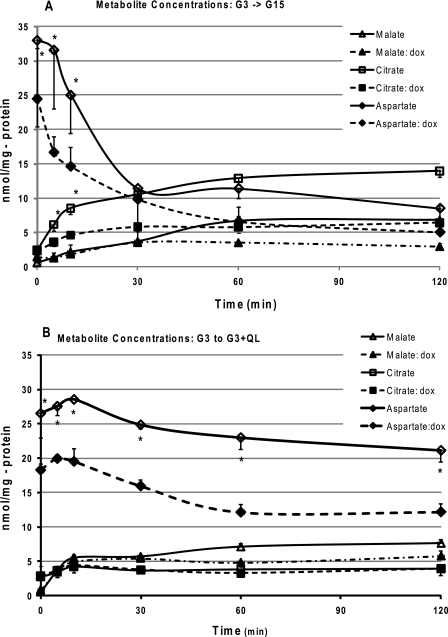
Maturity Onset Diabetes of the Young-type 3 (MODY-3) has been linked to mutations in the transcription factor hepatic nuclear factor (HNF)-1alpha, resulting in deficiency in glucose-stimulated insulin secretion. In INS-1 cells overexpressing doxycycline-inducible HNF-1alpha dominant-negative (DN-) gene mutations, and islets from Hnf-1alpha knock-out mice, insulin secretion was impaired in response to glucose (15 mm) and other nutrient secretagogues. Decreased rates of insulin secretion in response to glutamine plus leucine and to methyl pyruvate, but not potassium depolarization, indicate defects specific to mitochondrial metabolism. To identify the biochemical mechanisms responsible for impaired insulin secretion, we used (31)P NMR measured mitochondrial ATP synthesis (distinct from glycolytic ATP synthesis) together with oxygen consumption measurements to determine the efficiency of mitochondrial oxidative phosphorylation. Mitochondrial uncoupling was significantly higher in DN-HNF-1alpha cells, such that rates of ATP synthesis were decreased by approximately one-half in response to the secretagogues glucose, glutamine plus leucine, or pyruvate. In addition to closure of the ATP-sensitive K(+) channels with mitochondrial ATP synthesis, mitochondrial production of second messengers through increased anaplerotic flux has been shown to be critical for coupling metabolism to insulin secretion. (13)C-Isotopomer analysis and tandem mass spectrometry measurement of Krebs cycle intermediates revealed a negative impact of DN-HNF-1alpha and Hnf-1alpha knock-out on mitochondrial second messenger production with glucose but not amino acids. Taken together, these results indicate that, in addition to reduced glycolytic flux, uncoupling of mitochondrial oxidative phosphorylation contributes to impaired nutrient-stimulated insulin secretion with either mutations or loss of HNF-1alpha.


Figures

FIGURE 1.
FIGURE 1.
A, Western blot analysis of induction of DN-HNF-1α by doxycycline in INS-1 cells. Extracts from DN-HNF-1α cells cultured for 24 h with and without 500 ng·ml doxycycline were resolved in 9% SDS-PAGE, transferred to nitrocellulose, and immunoblotted against an antibody directed against amino acid residues 70–269 of mouse HNF-1α. B, effects of DN-HNF-1α on HNF1α target genes. RNA was extracted and reverse transcribed from cells that were cultured in RPMI with 3 mm glucose with or without 500 ng/ml of doxycycline for 24 h. All cDNA samples for quantitative RT-PCR were normalized to β-actin expression and compared with the non-dox-treated control cells. C, effects of DN-HNF-1α on relative mRNA expression levels of cytosolic malic enzyme 1 (ME1) and mitochondrial malic enzyme (ME2) isoforms referenced to expression in the clonal INS-1 832/13 cell line. mRNA expression of the HNF1α mutant INS-1, nontreated INS-1 and INS-1 832/13 cells, all with similar β-actin CTs, were normalized to β-actin expression and compared with ME1 expression in INS-1 832/13 cells. Data were analyzed using Δ/ΔCT method. Data are mean ± S.E., with significance determined by Student's t test (no dox versus plus dox: ***, p < 0.001, **, p < 0.01).
FIGURE 2.
FIGURE 2.
Effects of DN-HNF-1α on insulin secretion. Cumulative rates of insulin secretion from doxycycline-induced DN-HNF-1α INS-1 cell static incubations were compared with nontreated (minus doxycycline) cells. Cells were placed in 3 mm glucose culture media minus or plus doxycycline 24 h prior to the incubation. On the day of the study, cells were equilibrated for 0.5 h and incubated in KRB with 0.2% BSA (37 °C) and the specified substrates. G3, 3 mm glucose; G15, 15 mm glucose; G3 + QL, G3 plus 4 mm glutamine and 10 mm leucine; G3 + MP, G3 plus 10 mm methyl pyruvate; G3 + SAME, G3 plus 4 mm succinic acid methyl ester; G3 + KCl, G3 plus 30 mm KCl. Insulin was analyzed by ELISA and normalized to total cellular insulin. Data are mean ± S.E. of a minimum of three repeated measures for each condition, with significance determined by Student's t test (no dox versus plus dox: ***, p < 0.001; **, p < 0.01). All conditions resulted in a significant (p < 0.05) increase in rate of insulin secretion compared with the basal rate.
FIGURE 3.
FIGURE 3.
Insulin secretion from islets isolated from HNF-1α KO mice and WT littermates. A, islets (50–80) were layered between a slurry of acrylamide gel column beads (Bio-Gel P4G (156-4124)) and KRB with 3 mm glucose and loaded into the perifusion chamber. After a 1-h equilibration period, the islets were perifused at 100 μl/min with well oxygenated 3 mm KRB (37 °C). The islets were then perifused with the indicated agonists as follows: G3, 3 mm glucose; G3 + QL, G3 plus 4 mm glutamine and 10 mm leucine; G20, 20 mm glucose; G3 + KCl, G3 plus 30 mm KCl; G20 + forskolin, G20 plus 10 μm forskolin. Secreted insulin was normalized to islet DNA. We typically performed simultaneous perifusions of two to three chambers for both the KO and WT islets for each session. B, mean integrated area under the insulin secretion curves from A were determined for each condition for the KO and WT islets. Data are mean ± S.E. of a two independent islet preparations with duplicate or triplicate perifusions from the same islet preparation. Significance was determined by Student's t test (*, p < 0.05 comparison of WT to KO).
FIGURE 4.
FIGURE 4.
Representative 31P NMR spectra of alginate-entrapped DN-HNF-1α control cells (no doxycycline) perifused in oxygenated KRB buffer with 15 mm glucose (spectrum A). The resonances in the control spectrum at G15 (spectrum A) of the saturation transfer experiment (saturation pulse downfield of Pi) correspond to extracellular Pi at 2.73 ppm and intracellular Pi at 2.39 ppm. The difference of the two spectra of the saturation transfer experiment (saturation pulse at γ-ATP, or downfield of Pi) reveals metabolically active intracellular Pi pools with their chemical shifts dependent upon the pH of their respective intracellular compartment. Increasing the glucose from 3 to 15 mm caused a downfield shift of ∼47 Hz in the mitochondrial Pi corresponding to a pH shift of ∼0.3. For ease of comparison, the difference spectra (B and C) are shown inverted. (In the difference spectra, the γ-ATP peaks and Pi peaks are normally negative excursion.)
FIGURE 5.
FIGURE 5.
Effects of DN-HNF-1α on parameters of ATP synthesis in response to nutrient secretagogues measured by 31P NMR saturation transfer experiments as described under “Experimental Procedures” and in Fig. 5. Cells were cultured as described in Fig. 2. Parameters were measured in KRB with basal glucose concentration of 3 mm (G3), stimulatory glucose of 15 mm (G15), G3 plus 4 mm glutamine (Q) and 10 mm leucine (L), and G3 plus 2 mm pyruvate (P). A, rate constant (kATP) for unidirectional ATP synthesis in mitochondria. B, mitochondrial ATP synthesis rates calculated from the mitochondrial rate constant and cytosolic Pi concentration at t = 0. C, cytosolic ATP synthesis rates calculated from the cytosolic rate constant and cytosolic Pi concentration. D, cytosolic Pi concentration calculated from the 31P NMR peak intensity of intracellular Pi normalized to the constant extracellular Pi and from LC/MS/MS determined concentration. Data are mean ± S.E. of four to six NMR-perifusion experiments for each condition, with significance determined by Student's t test (no dox versus plus dox: **, p < 0.01; *, p < 0.05, compared with basal: #, p < 0.05).
FIGURE 6.
FIGURE 6.
Effects of DN-HNF-1α on OCR, mitochondrial uncoupling, superoxide production, and ATP/ADP concentrations. Cells were cultured as described in Fig. 2 (except without BSA) and under “Experimental Procedures.” A, OCRs were measured after a 1-h pre-equilibration in KRB (G3, 37 °C) prior to transfer to chamber and OCR measurements. OCRs were measured in KRB (37 °C) with basal glucose concentration of 3 mm (G3), stimulatory glucose of 15 mm (G15), G3 plus 4 mm glutamine (Q), and 10 mm leucine (L), and G3 plus 2 mm pyruvate. B, index of oxidative phosphorylation efficiency was calculated as the ratio of mitochondrial ATP synthesis rates (Fig. 5B) and OCR (A). Data are mean ± S.E. of a minimum of three repeated measures for each condition. C, mitochondrial superoxide production was evaluated in mitochondria isolated from DN-HNF-1α cells cultured with or without doxycycline for 24 h. The mitochondria were isolated and resuspended in an isotonic buffer as described previously (13), and superoxide production was determined from the oxidation of HEt (Molecular Probes, Inc). Mitochondria were aliquoted into a 96-well plate (∼50 ng of mDNA per well) and equilibrated to 37 °C, and HEt was added at a concentration of 5 μm. Oxidation of HEt was monitored at 5-s intervals by measuring the change in fluorescence (excitation, 545 nm; emission, 590 nm) with a FlexStation3 (Molecular Devices, Sunnyvale, CA) during a 15-min equilibration period, a 15-min stimulus period with pyruvate at 10 mm, and for 15 min after the addition of FCCP (2 μm final concentration). Rates of HEt reaction with superoxide were calculated from the slope before and after addition of FCCP. D, total cellular ATP/ADP ratios were measured following a 1-h preincubation in KRB with 3 mm glucose, and an additional 2-h incubation in KRB with glucose at either 3, 15, or 3 mm with glutamine (4 mm) and leucine (10 mm). Cells were extracted with ice-cold acetonitrile/water at 5 and 10 min, and the nucleotide concentrations were determined by LC/MS/MS as described under “Experimental Procedures.” Data are mean ± S.E. determined in triplicate with two independent experiments for each condition. Significance was determined by Student's t test (no dox versus plus dox: *, p < 0.05; compared with basal: #, p < 0.05).
FIGURE 7.
FIGURE 7.
Steady-state flux rates relative to Krebs cycle flux rate. DN-HNF-1α cells ± dox, or islets from HNF-1α KO and WT littermate mice, were cultured as described in Fig. 2 and under “Experimental Procedures.” After a 2-h preincubation in KRB (G3), the medium was replaced with KRB with [U-13C]glucose at either 3, 15, or 3 mm with glutamine (4 mm) and leucine (10 mm). After a 2-h incubation, cellular extracts were prepared, and the 13C-isotopic positional enrichment was determined by 13C NMR spectroscopy or LC tandem-mass spectrometry as described under “Experimental Procedures.” Pathways were calculated using the program “tcacalc” (–11), for PDH flux from exogenous glucose (A, cells; C, islets) and total anaplerotic flux from all sources (B, cells; D, islets). Data are means ± S.E. of a minimum of four to five repeated measures for each condition, with significance determined by Student's t test (wild type to KO: p < 0.05; compared with basal: #, p < 0.05).
FIGURE 8.
FIGURE 8.
Effects of DN-HNF-1α on changes in the concentrations of the anaplerotic products, citrate and malate, and aspartate in response to insulin secretagogues. Cells were cultured as described in Fig. 2 (without BSA) under “Experimental Procedures.”. After a 2-h preincubation in KRB (G3), the media were replaced with KRB with glucose at either 15 mm (A) or 3 mm (B) with glutamine (4 mm) and leucine (10 mm). Cells were extracted with ice-cold acetonitrile/water at the designated times, and the malate and citrate concentrations were determined by LC/MS/MS as described under “Experimental Procedures.” Data are means ± S.E. determined in triplicate for two independent experiments for each time point, with significance determined by Student's t test (no dox versus plus dox: *, p < 0.05).

Similar articles

Cited by

References

    1. Fajans S. S. ( 1989) Diabetes Metab. Rev. 5, 579– 606 - PubMed
    1. Yamagata K., Oda N., Kaisaki P. J., Menzel S., Furuta H., Vaxillaire M., Southam L., Cox R. D., Lathrop G. M., Boriraj V. V., Chen X., Cox N. J., Oda Y., Yano H., Le Beau M. M., Yamada S., Nishigori H., Takeda J., Fajans S. S., Hattersley A. T., Iwasaki N., Hansen T., Pederson O., Polonsky K. S., Bell G. I., et al. ( 1996) Nature 384, 455– 458 - PubMed
    1. Pontoglio M., Sreenan S., Roe M., Pugh W., Ostrega D., Doyen A., Pick A. J., Baldwin A., Velho G., Froguel P., Levisetti M., Bonner-Weir S., Bell G. I., Yaniv M., Polonsky K. S. ( 1998) J. Clin. Investig. 101, 2215– 2222 - PMC - PubMed
    1. Dukes I. D., Sreenan S., Roe M. W., Levisetti M., Zhou Y. P., Ostrega D., Bell G. I., Pontoglio M., Yaniv M., Philipson L., Polonsky K. S. ( 1998) J. Biol. Chem. 273, 24457– 24464 - PubMed
    1. Shih D. Q., Screenan S., Munoz K. N., Philipson L., Pontoglio M., Yaniv M., Polonsky K. S., Stoffel M. ( 2001) Diabetes 50, 2472– 2480 - PubMed

Publication types

MeSH terms