. 2009 Jun;150(2):786-800.
doi: 10.1104/pp.109.135418. Epub 2009 Apr 17.

Disruption of OsYSL15 leads to iron inefficiency in rice plants

Affiliations

Disruption of OsYSL15 leads to iron inefficiency in rice plants

Sichul Lee et al. Plant Physiol. 2009 Jun.

Abstract

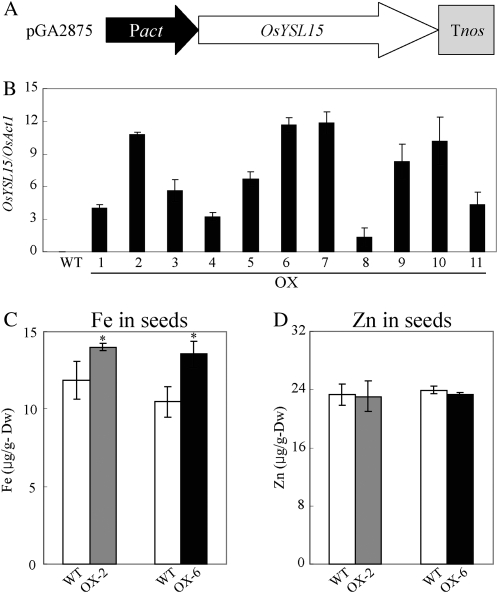
Uptake and translocation of metal nutrients are essential processes for plant growth. Graminaceous species release phytosiderophores that bind to Fe(3+); these complexes are then transported across the plasma membrane. We have characterized OsYSL15, one of the rice (Oryza sativa) YS1-like (YSL) genes that are strongly induced by iron (Fe) deficiency. The OsYSL15 promoter fusion to beta-glucuronidase showed that it was expressed in all root tissues when Fe was limited. In low-Fe leaves, the promoter became active in all tissues except epidermal cells. This activity was also detected in flowers and seeds. The OsYSL15:green fluorescent protein fusion was localized to the plasma membrane. OsYSL15 functionally complemented yeast strains defective in Fe uptake on media containing Fe(3+)-deoxymugineic acid and Fe(2+)-nicotianamine. Two insertional osysl15 mutants exhibited chlorotic phenotypes under Fe deficiency and had reduced Fe concentrations in their shoots, roots, and seeds. Nitric oxide treatment reversed this chlorosis under Fe-limiting conditions. Overexpression of OsYSL15 increased the Fe concentration in leaves and seeds from transgenic plants. Altogether, these results demonstrate roles for OsYSL15 in Fe uptake and distribution in rice plants.


Figures

Figure 1.
Figure 1.
Real-time PCR analysis of OsYSL genes under different Fe concentrations. Seedlings were grown for 7 d on MS medium containing 0, 1, 10, 100, or 500 μm Fe. Each value is the average of three independent experiments. Transcript levels are represented by the ratio between mRNA levels of OsYSL2 (A), OsYSL9 (B), OsYSL15 (C), and OsYSL16 (D) and those of rice Actin1. The nomenclature of OsYSL genes in this study is the same as presented by Koike et al. (2004). Error bars indicate sd. Gene-specific primers are listed in Supplemental Table S2.
Figure 2.
Figure 2.
Spatial expression patterns of the OsYSL15-GUS construct. A, Five-day-old seedlings grown on Fe-sufficient (Fe+) or Fe-deficient (Fe−) medium. B, Cross section of a 5-d-old seedling root grown under Fe-sufficient conditions. The analyzed region is at the differentiation zone (arrowhead in A). C, Cross section of a 5-d-old seedling root grown on Fe-deficient medium. The analyzed region is at the differentiation zone (arrowhead in A). D and E, Cross sections of midrib regions from leaves under Fe-sufficient (D) or Fe-deficient (E) conditions. The analyzed regions are indicated as arrowheads in A. F and G, GUS expression in leaf blades under Fe-sufficient (F) or Fe-deficient (G) conditions. H, Temporal and spatial expression patterns of OsYSL15-GUS fusion in spikelets at various developmental stages. Samples are as follows: 1, tetrad; 2, early young microspore; 3, late young microspore; 4, vacuolated pollen; 5, late pollen mitosis; 6, dehulled flower at late pollen mitosis stage. I, GUS activity in developing seeds at various stages. Samples are as follows: 1, 3 d after pollination (DAP); 2, 5 DAP; 3, 7 DAP; 4, 10 DAP; 5, 20 DAP. A, Anther; AR, aerenchyma; C, cortex; CE, chalazal end; E, embryo; ED, endodermis; EP, epidermis; EX, exodermis; G, glume; LO, lodicules; M mesophyll; P, palea; V, vascular bundle. Bars = 0.5 cm in A, 50 μm in B to G, 1 mm in H, and 0.5 mm in I.
Figure 3.
Figure 3.
Subcellular localization of OsYSL15:GFP in onion epidermal cells. A, Schematic diagrams of fusion constructs. P35S, Cauliflower mosaic virus 35S promoter; Tnos, nopaline synthase gene terminator. B, Onion cells cotransformed with OsYSL15:GFP and AHA2:RFP fusion constructs via particle bombardment. Fluorescent signals were examined 12 h after transfection. Data are representative of transformed cells. At least two independent transformation experiments were performed with each construct. “Merged” indicates that green and red signals were merged. Expression of GFP alone was analyzed as a control. Bar = 25 μm.
Figure 4.
Figure 4.
Functional complementation of fet3fet4 yeast. DEY1453-derived yeast strains transformed with pGEV-TRP and constructs expressing OsYSL15 or empty pYES6/CT were grown on synthetic defined medium containing 50 μm Fe citrate (A and G); 10 μm FeCl3 with 40 nm β-estradiol (B); 10 μm FeCl3 with 10 μm DMA and 40 nm β-estradiol (C); 10 μm FeCl3 with 10 μm DMA without β-estradiol (D); 10 μm FeCl3 with 10 μm DMA, 10 μm BPDS, and 40 nm β-estradiol (E); 10 μm FeCl3, 10 μm DMA, and 10 μm BPDS without β-estradiol (F); 3 μm FeSO4 with 10 nm β-estradiol (H); 3 μm FeSO4 with 8 μm NA and 10 nm β-estradiol (I); or 3 μm FeSO4 with 8 μm NA without β-estradiol (J). Pairs of spots correspond to 10-fold and 100-fold dilutions of original cultures.
Figure 5.
Figure 5.
Isolation and characterization of OsYSL15 knockout mutant plants. A, Schematic diagram of OsYSL15 and insertion positions of T-DNA. Black boxes indicate seven exons, and connecting black lines represent introns. In line 2D10712, T-DNA was inserted into the second intron (osysl15-1) of OsYSL15; in line 3A10357, DNA was inserted into the second exon (osysl15-2) of OsYSL15. Horizontal arrowheads indicate primers (F1, R1, F2, and R2) used for genotyping T2 progeny. LB, Left border; RB, right border. B, RT-PCR analyses of OsYSL15 expression. OsYSL15-specific primers (Fw and Rv) were used with total RNA from leaves of osysl15-1, osysl15-2, or segregated wild-type (WT) seedlings grown under Fe deficiency. Rice Actin1 (OsAct1) was amplified as an internal control. C to E, Phenotype analyses of OsYSL15 knockout plants at seedling stage under Fe and Zn deficiencies. Homozygous and wild-type progeny of osysl5-1 and osysl15-2 were germinated and grown for 10 d on solid MS medium in the presence of Fe (100 μm) and Zn (30 μm) or in the absence of Fe (Fe−) or Zn (Zn−). Bottom panels show enlargements of second leaves. C, Wild-type and knockout mutant plants grown on MS control medium. D, Wild-type and knockout mutant plants grown on Fe-deficient medium. E, Wild-type and knockout mutant plants grown on Zn-deficient medium. Photographs were taken 10 d after germination. Bars = 5 cm. [See online article for color version of this figure.]
Figure 6.
Figure 6.
A and B, Fe (A) and Zn (B) concentrations in shoots and roots from wild-type (WT) and osysl15 mutant plants grown on standard MS, Fe-deficient (Fe−), or Zn-deficient (Zn−) medium. At least two independent experiments were conducted for metal measurements, each using four plants. C and D, Fe concentrations in protoplasts and chloroplasts from wild-type and osysl15-1 plants grown on standard MS or Fe-deficient (Fe−) medium. E, Fe concentration in seeds from paddy-grown plants. F, Zn concentration in 10 pooled seeds, with four replicates prepared. Error bars indicate se. Significant differences from the wild type were determined by Student's t test (* P < 0.05). Dw, Dry weight; Fw, fresh weight.
Figure 7.
Figure 7.
Effect of NO on reversion of chlorosis in the osysl15-1 mutant. A, Seeds were germinated and plants grown on Fe-sufficient (Fe+) or Fe-deficient (Fe−) medium containing various concentrations of SNP. Photographs were taken from middle sections of second leaves at 10 d after treatment. For NO depletion, 100 μm CPTIO was added to growth medium. B, Phenotypes of 10-d-old plants grown on Fe-deficient medium containing 50 μm SNP. C, Inhibitory effect of CPTIO on NO-treated plants. WT, Wild type. Bars = 5 cm. [See online article for color version of this figure.]
Figure 8.
Figure 8.
Expression analysis for Fe homeostasis-related genes. RNA was prepared from 10-d-old shoots. A, Real-time PCR analysis of three rice NAS genes and two rice ferritin genes after SNP treatment. B, Expression analyses of OsNAS and Osferritin genes in plants grown on medium supplemented with 100 μm CPTIO, an NO inhibitor. Transcript levels are represented by the ratio between mRNA level for OsNAS or Osferritin genes and that for rice Actin1. Error bars indicate sd. WT, Wild type.
Figure 9.
Figure 9.
Generation of transgenic plants overexpressing OsYSL15. A, Schematic diagram of the pGA2875 construct. OsYSL15 cDNA was placed between the rice Actin promoter (Pact) and the nopaline synthase terminator (Tnos). B, Quantitative real-time PCR analysis of overexpression transgenic plants using RNA from leaves. Error bars indicate sd. Transcript levels are represented by the ratio between mRNA level for OsYSL15 and that for rice Actin1. C and D, Fe and Zn concentrations in mature seeds from wild-type and OsYSL15-overexpressing (OX-2 and OX-6) plants grown in paddy fields. WT indicates segregated siblings of selected lines. Error bars indicate se. * P < 0.05. Dw, Dry weight.
Figure 10.
Figure 10.
Phenotype analyses of OsYSL15-overexpressing transgenic and osysl15-1 plants grown under different Fe concentrations. A, Representative photographs of second leaves. WT and T/T indicate segregated wild-type and homozygous plants from selected lines. B, Chlorophyll concentrations from plants (n = 4) grown at different Fe concentrations. Error bars indicate se. * P < 0.05. [See online article for color version of this figure.]
Figure 11.
Figure 11.
Phenotypes of OsYSL15 knockout and overexpressing transgenic plants grown in the paddy field. Representative photographs were taken after plants flowered. A and B, Comparisons among wild-type (WT), osysl15-1, and osysl15-2 plants. C and D, Comparison of wild-type and OsYSL15-overexpressing (OX-2 and OX-6) plants. For the photographs, transgenic plants were transferred to pots from the paddy fields. Bars = 10 cm. E and F, Fe (E) and Zn (F) concentrations in flag leaves, with each measured from four flag leaves per line sampled after flowering. Error bars indicate se. * P < 0.05. [See online article for color version of this figure.]

Similar articles

Cited by

References

    1. An G, Ebert PR, Mitra A, Ha SB (1988) Binary vectors. In SB Gelvin, RA Schilperoort, eds, Plant Molecular Biology Manual. Kluwer Academic Publishers, Dordrecht, The Netherlands, pp A3/1–A3/19
    1. An S, Park S, Jeong DH, Lee DY, Kang HG, Yu JH, Hur J, Kim SR, Kim YH, Lee M, et al (2003) Generation and analysis of end sequence database for T-DNA tagging lines in rice. Plant Physiol 133 2040–2047 - PMC - PubMed
    1. Anbar M (1995) Nitric oxide: a synchronizing chemical messenger. Experientia 51 545–550 - PubMed
    1. Arnon DI (1949) Copper enzymes in isolated chloroplasts: polyphenoloxidase in Beta vulgaris. Plant Physiol 24 1–15 - PMC - PubMed
    1. Bashir K, Inoue H, Nagasaka S, Takahashi M, Nakanishi H, Mori S, Nishizawa NK (2006) Cloning and characterization of deoxymugineic acid synthase genes from graminaceous plants. J Biol Chem 281 32395–32402 - PubMed

Publication types

MeSH terms

Associated data