Recruitment of the ParG segregation protein to different affinity DNA sites
- PMID: 19376860
- PMCID: PMC2698407
- DOI: 10.1128/JB.01630-08
Recruitment of the ParG segregation protein to different affinity DNA sites
Abstract
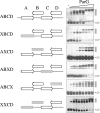
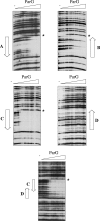
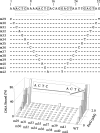
The segrosome is the nucleoprotein complex that mediates accurate plasmid segregation. In addition to its multifunctional role in segrosome assembly, the ParG protein of multiresistance plasmid TP228 is a transcriptional repressor of the parFG partition genes. ParG is a homodimeric DNA binding protein, with C-terminal regions that interlock into a ribbon-helix-helix fold. Antiparallel beta-strands in this fold are presumed to insert into the O(F) operator major groove to exert transcriptional control as established for other ribbon-helix-helix factors. The O(F) locus comprises eight degenerate tetramer boxes arranged in a combination of direct and inverted orientation. Each tetramer motif likely recruits one ParG dimer, implying that the fully bound operator is cooperatively coated by up to eight dimers. O(F) was subdivided experimentally into four overlapping 20-bp sites (A to D), each of which comprises two tetramer boxes separated by AT-rich spacers. Extensive interaction studies demonstrated that sites A to D individually are bound with different affinities by ParG (C > A approximately B >> D). Moreover, comprehensive scanning mutagenesis revealed the contribution of each position in the site core and flanking sequences to ParG binding. Natural variations in the tetramer box motifs and in the interbox spacers, as well as in flanking sequences, each influence ParG binding. The O(F) operator apparently has evolved with sites that bind ParG dissimilarly to produce a nucleoprotein complex fine-tuned for optimal interaction with the transcription machinery. The association of other ribbon-helix-helix proteins with complex recognition sites similarly may be modulated by natural sequence variations between subsites.
Figures


Similar articles
-
Segrosome assembly at the pliable parH centromere.Nucleic Acids Res. 2011 Jul;39(12):5082-97. doi: 10.1093/nar/gkr115. Epub 2011 Mar 4. Nucleic Acids Res. 2011. PMID: 21378121 Free PMC article.
-
The unstructured N-terminal tail of ParG modulates assembly of a quaternary nucleoprotein complex in transcription repression.J Biol Chem. 2005 Aug 5;280(31):28683-91. doi: 10.1074/jbc.M501173200. Epub 2005 Jun 12. J Biol Chem. 2005. PMID: 15951570
-
The tail of the ParG DNA segregation protein remodels ParF polymers and enhances ATP hydrolysis via an arginine finger-like motif.Proc Natl Acad Sci U S A. 2007 Feb 6;104(6):1811-6. doi: 10.1073/pnas.0607216104. Epub 2007 Jan 29. Proc Natl Acad Sci U S A. 2007. PMID: 17261809 Free PMC article.
-
ParG, a protein required for active partition of bacterial plasmids, has a dimeric ribbon-helix-helix structure.Mol Microbiol. 2003 Nov;50(4):1141-53. doi: 10.1046/j.1365-2958.2003.03750.x. Mol Microbiol. 2003. PMID: 14622405
-
Cooperative and anticooperative effects in binding of the first and second plasmid Osym operators to a LacI tetramer: evidence for contributions of non-operator DNA binding by wrapping and looping.J Mol Biol. 1996 Aug 2;260(5):697-717. doi: 10.1006/jmbi.1996.0431. J Mol Biol. 1996. PMID: 8709149
Cited by
-
Breaking and restoring the hydrophobic core of a centromere-binding protein.J Biol Chem. 2015 Apr 3;290(14):9273-83. doi: 10.1074/jbc.M115.638148. Epub 2015 Feb 23. J Biol Chem. 2015. PMID: 25713077 Free PMC article.
-
Structural mechanism of ATP-induced polymerization of the partition factor ParF: implications for DNA segregation.J Biol Chem. 2012 Jul 27;287(31):26146-54. doi: 10.1074/jbc.M112.373696. Epub 2012 Jun 6. J Biol Chem. 2012. PMID: 22674577 Free PMC article.
-
Genome Segregation by the Venus Flytrap Mechanism: Probing the Interaction Between the ParF ATPase and the ParG Centromere Binding Protein.Front Mol Biosci. 2020 Jun 16;7:108. doi: 10.3389/fmolb.2020.00108. eCollection 2020. Front Mol Biosci. 2020. PMID: 32613008 Free PMC article.
-
Combinatorial targeting of ribbon-helix-helix artificial transcription factors to chimeric recognition sites.Nucleic Acids Res. 2012 Aug;40(14):6673-82. doi: 10.1093/nar/gks314. Epub 2012 Apr 9. Nucleic Acids Res. 2012. PMID: 22492712 Free PMC article.
-
Segrosome Complex Formation during DNA Trafficking in Bacterial Cell Division.Front Mol Biosci. 2016 Sep 9;3:51. doi: 10.3389/fmolb.2016.00051. eCollection 2016. Front Mol Biosci. 2016. PMID: 27668216 Free PMC article. Review.
References
-
- Adachi, S., K. Hori, and S. Hiraga. 2006. Subcellular positioning of F plasmid mediated by dynamic localization of SopA and SopB. J. Mol. Biol. 356850-863. - PubMed
-
- Ahmadian, M. R., P. Stege, K. Scheffzek, and A. Wittinghofer. 1997. Confirmation of the arginine-finger hypothesis for the GAP-stimulated GTP-hydrolysis reaction of Ras. Nat. Struct. Biol. 4686-689. - PubMed
-
- Barillà, D., and F. Hayes. 2003. Architecture of the ParF-ParG protein complex involved in procaryotic DNA segregation. Mol. Microbiol. 49487-499. - PubMed
Publication types
MeSH terms
Substances
Grants and funding
LinkOut - more resources
Full Text Sources

