. 2009 Apr;21(4):1053-69.
doi: 10.1105/tpc.109.065714. Epub 2009 Apr 17.

Genome-wide and organ-specific landscapes of epigenetic modifications and their relationships to mRNA and small RNA transcriptomes in maize

Affiliations

Genome-wide and organ-specific landscapes of epigenetic modifications and their relationships to mRNA and small RNA transcriptomes in maize

Xiangfeng Wang et al. Plant Cell. 2009 Apr.

Abstract

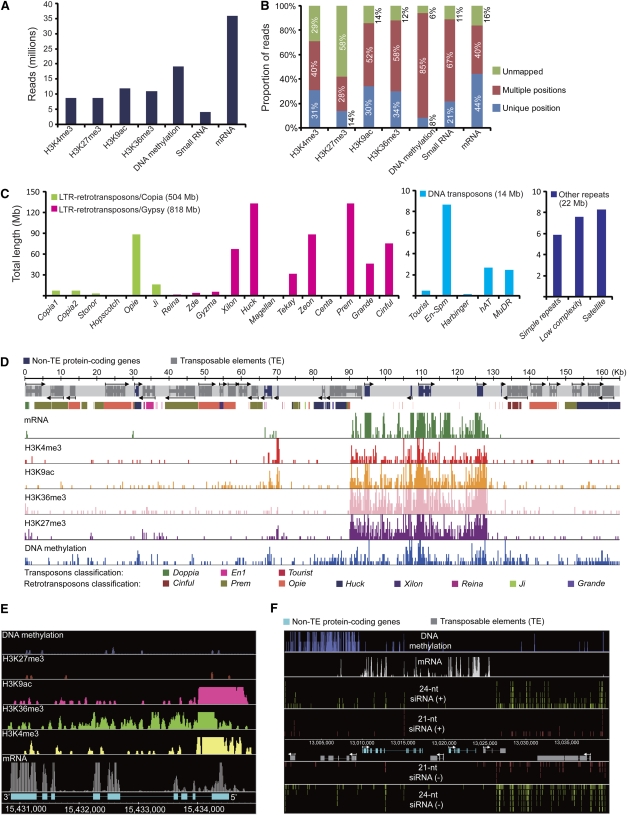
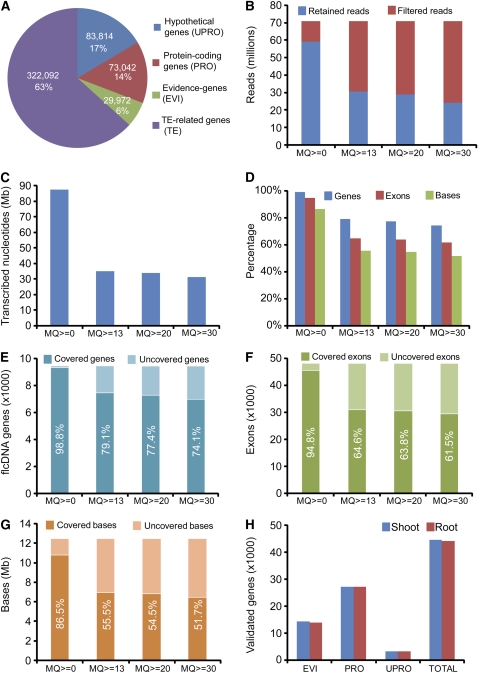
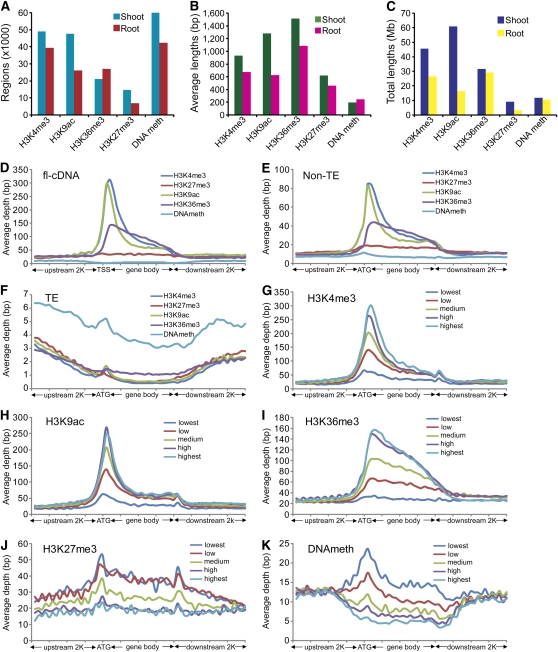
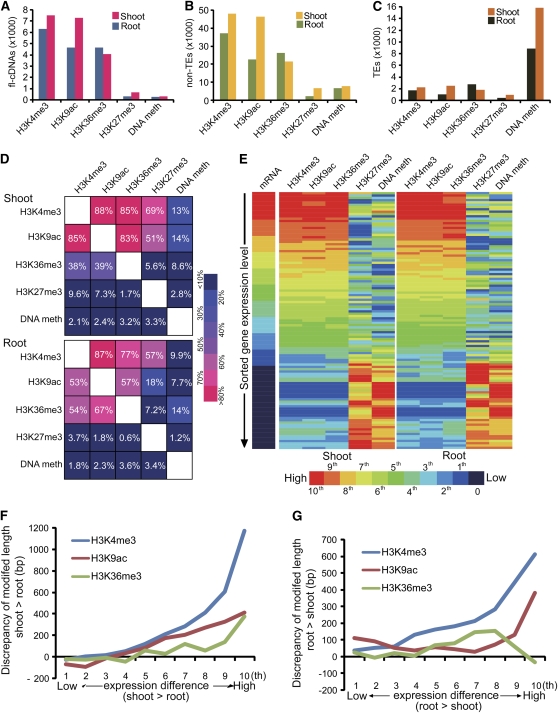
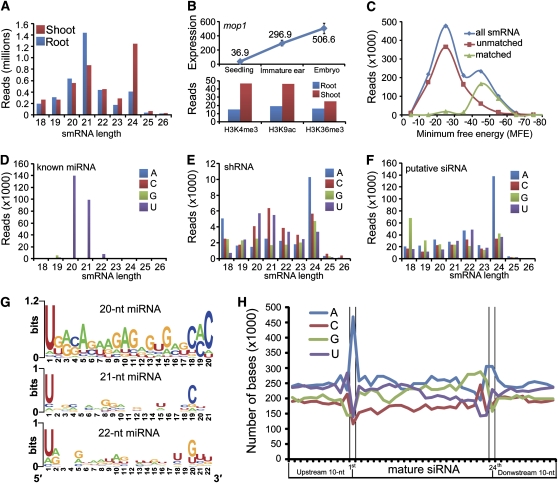
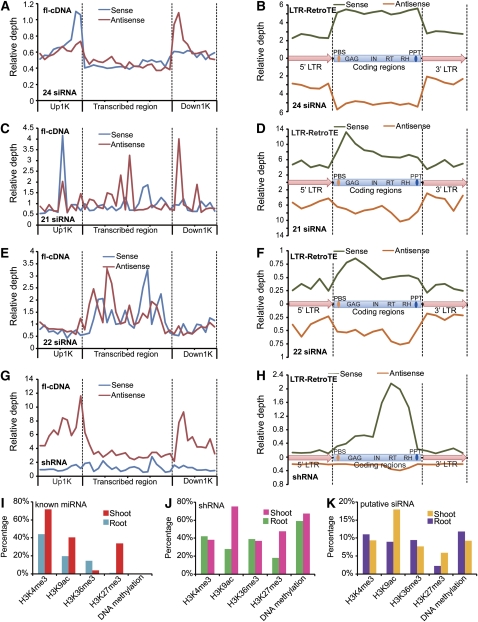
Maize (Zea mays) has an exceptionally complex genome with a rich history in both epigenetics and evolution. We report genomic landscapes of representative epigenetic modifications and their relationships to mRNA and small RNA (smRNA) transcriptomes in maize shoots and roots. The epigenetic patterns differed dramatically between genes and transposable elements, and two repressive marks (H3K27me3 and DNA methylation) were usually mutually exclusive. We found an organ-specific distribution of canonical microRNAs (miRNAs) and endogenous small interfering RNAs (siRNAs), indicative of their tissue-specific biogenesis. Furthermore, we observed that a decreasing level of mop1 led to a concomitant decrease of 24-nucleotide siRNAs relative to 21-nucleotide miRNAs in a tissue-specific manner. A group of 22-nucleotide siRNAs may originate from long-hairpin double-stranded RNAs and preferentially target gene-coding regions. Additionally, a class of miRNA-like smRNAs, whose putative precursors can form short hairpins, potentially targets genes in trans. In summary, our data provide a critical analysis of the maize epigenome and its relationships to mRNA and smRNA transcriptomes.


Figures

Figure 1.
Figure 1.
Sequencing, Mapping, and Visualization of the Maize Transcriptome, Epigenome, and smRNAome. (A) Counts of quality reads from Illumina/Solexa 1G sequencing. (B) Proportions of unmapped and mapped reads with unique and multiple locations. (C) Distribution of classified repetitive sequences in maize 2.4-Gb BAC sequences. (D) A representative BAC (AC199189.3) showing predicted gene models with mRNA and epigenetic landscapes in shoots. (E) Distribution of epigenetic patterns on an actively transcribed gene in shoots. (F) The 21- and 24-nucleotide siRNAs are enriched in methylation-depleted regions in shoots.
Figure 2.
Figure 2.
Validation of flcDNAs and FgeneSH-Predicted Genes. (A) FgeneSH-predicted maize genes in different groups. (B) Numbers of retained and filtered reads in 16 merged lanes of mRNA-seq reads using different mapping quality (MQ) scores. (C) Total lengths of transcribed nucleotides by adding up de novo exons using different MQ scores. (D) to (G) Percentages and numbers of validated flcDNAs at gene, exon, and base level. (H) Numbers of validated non-TE genes in different groups.
Figure 3.
Figure 3.
Genome-Wide and Genic Distribution Patterns of Epigenetic Modifications. (A) to (C) Numbers, average lengths, and total lengths of epigenetically modified regions detected by MACS software. (D) to (F) Distribution of H3K4me3, H3K27me3, H3K9ac, H3K36me3, and DNA methylation levels within flcDNAs, predicted TE-related, and non-TE genes aligned from TSSs and ATG, respectively. The y axis shows the average depth, which is the frequency of piled-up reads at each base divided by the bin size. The x axis represents the aligned genes that were equally binned into 40 portions, including 2K up- and downstream regions. (G) to (K) Distribution of H3K4me3, H3K27me3, H3K9ac, H3K36me3, and DNA methylation within five groups of genes with different expression levels summarized from validated non-TE genes.
Figure 4.
Figure 4.
Combinatory Modifications and Correlation with Gene Expression. (A) to (C) Numbers of modified flcDNAs, non-TEs, and TEs by H3K4me3, H3K9ac, H3K36me3, H3K27me3, and DNA methylation in shoot and root. (D) Frequencies of concurrent modifications on genes. Above the diagonal, numbers indicate the percentage of genes modified by X also have modification Y, while below the diagonal, percentages indicate how many genes were modified by Y and also modified by X. (E) Heat maps of epigenetic modification levels on ∼60,000 genes sorted by their expression measured by mRNA-seq. Gene expression levels and modifications levels were transformed to 100 percentiles, and each bar represents the averaged level of ∼600 genes within each percentile. (F) and (G) Correlation of differential modifications and differential gene expression in shoot and root. The y axis shows differences in the modification level of shoot higher than root and vice versa. The x axis shows the difference in the expression level of shoot higher than root and vice versa.
Figure 5.
Figure 5.
In Silico Classification Indicates Dynamic smRNA Populations in Maize Shoots and Roots. (A) smRNA length distributions in shoots and roots. (B) Tissue-specific expression and epigenetic modification of maize mop1 gene. (C) Distribution of smRNAs and matched and unmatched known miRNAs in miRBase within different MFE bins. (D) to (F) Length distributions of known miRNA, shRNAs, and putative siRNAs with different 5′ terminal nucleotides. (G) Sequence motifs of 20-, 21-, and 22-nucleotide miRNAs analyzed by WebLogo (Crooks et al., 2004). (H) Nucleotide composition of mature 24-nucleotide putative siRNAs.
Figure 6.
Figure 6.
22-Nucleotide siRNAs Are Differentially Enriched in Long Hairpin dsRNAs Rather Than in LTR-TEs. (A) to (C) Length distributions of putative siRNAs mapped on long hairpin dsRNAs. (A) Count of unique sequences; (B) and (C) total reads. (D) An example of a long hairpin dsRNAs generating more 22-nucleotide siRNAs than 24-nucleotide siRNAs. The loop region of ∼500 bp is not shown, and paired regions in stem are 99% in identity. Bubbles indicate unmatched nucleotides. (E) to (G) Length distributions of putative siRNAs mapped on full-length LTR-retrotransposons. (E) Count of unique sequences; (F) and (G) total reads.
Figure 7.
Figure 7.
Origin and Target Sites on Genes and LTR-TEs for Different Classes of Putative siRNAs. (A), (C), (E), and (G) The 24-, 21-, and 22-nucleotide siRNAs and shRNAs on flcDNA genes show significant strand bias on different positions in originating and targeting strands. (B), (D), (F), and (H) The 24-, 21-, and 22-nucleotide siRNAs and shRNAs on LTR-TEs. Calculation of relative depth and de novo identification of LTR-TEs is described in the supplemental data online. (I) to (K) Percentages of unique smRNA loci situated in epigenetic regions of H3K4me3, H3K9ac, H3K36me3, H3K27me3, and DNA methylation.

Comment in

References

    1. Aufsatz, W., Mette, M.F., van der Winden, J., Matzke, M., and Matzke, A.J.M. (2002). HDA6, a putative histone deacetylase needed to enhance DNA methylation induced by double-stranded RNA. EMBO J. 21 6832–6841. - PMC - PubMed
    1. Barski, A., Cuddapah, S., Cui, K., Roh, T.Y., Schones, D.E., Wang, Z., Wei, G., Chepelev, I., and Zhao, K. (2007). High-resolution profiling of histone methylations in the human genome. Cell 129 823–837. - PubMed
    1. Bernatavichute, Y.V., Zhang, X., Cokus, S., Pellegrini, M., and Jacobsen, S.E. (2008). Genome-wide association of histone H3 lysine nine methylation with CHG DNA methylation in Arabidopsis thaliana. PLoS One 3 e3156. - PMC - PubMed
    1. Bernstein, B.E., et al. (2006). A bivalent chromatin structure marks key developmental genes in embryonic stem cells. Cell 125 315–326. - PubMed
    1. Bonnet, E., Van de Peer, Y., and Rouzé, P. (2006). The small RNA world of plants. New Phytol. 171 451–468. - PubMed

Publication types