. 2009 Apr;21(4):1109-28.
doi: 10.1105/tpc.108.065250. Epub 2009 Apr 17.

GLK transcription factors coordinate expression of the photosynthetic apparatus in Arabidopsis

Affiliations

GLK transcription factors coordinate expression of the photosynthetic apparatus in Arabidopsis

Mark T Waters et al. Plant Cell. 2009 Apr.

Abstract

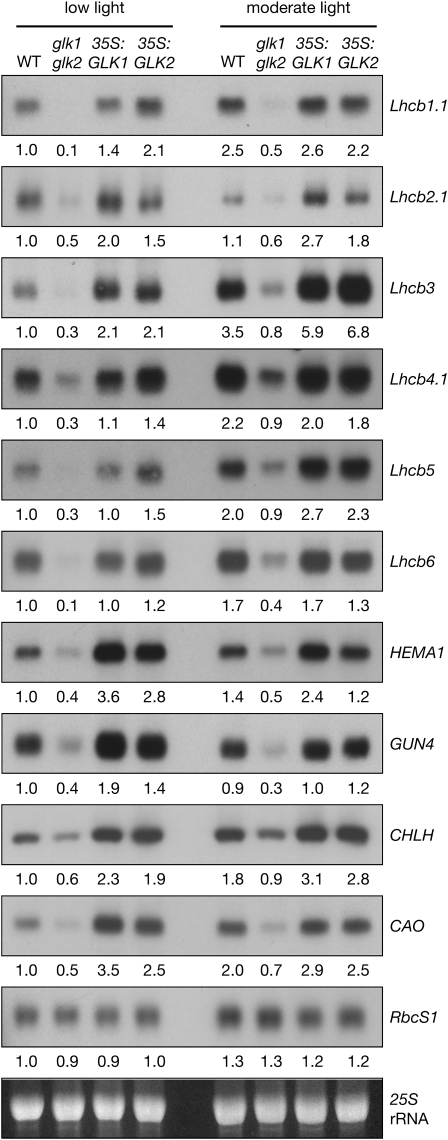
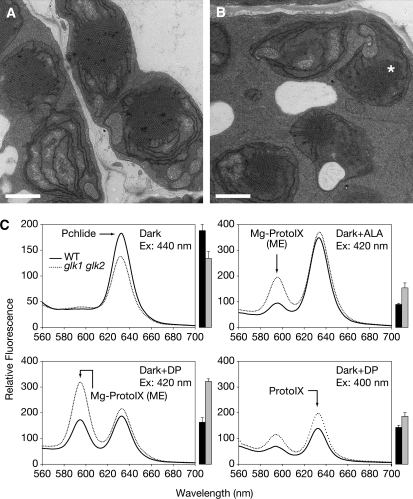
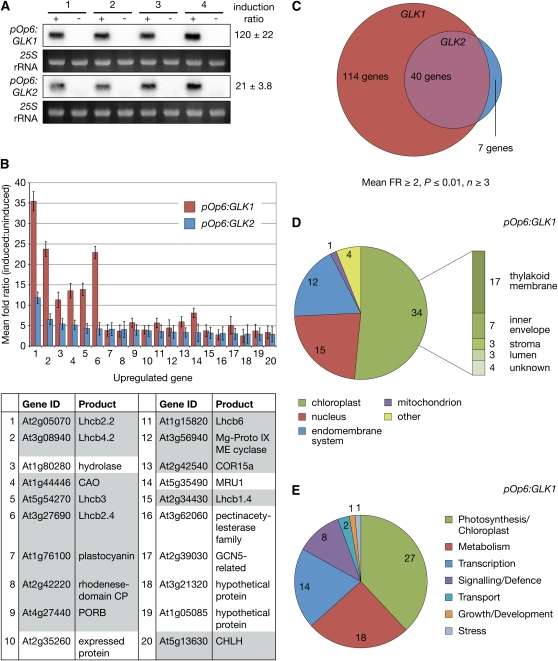
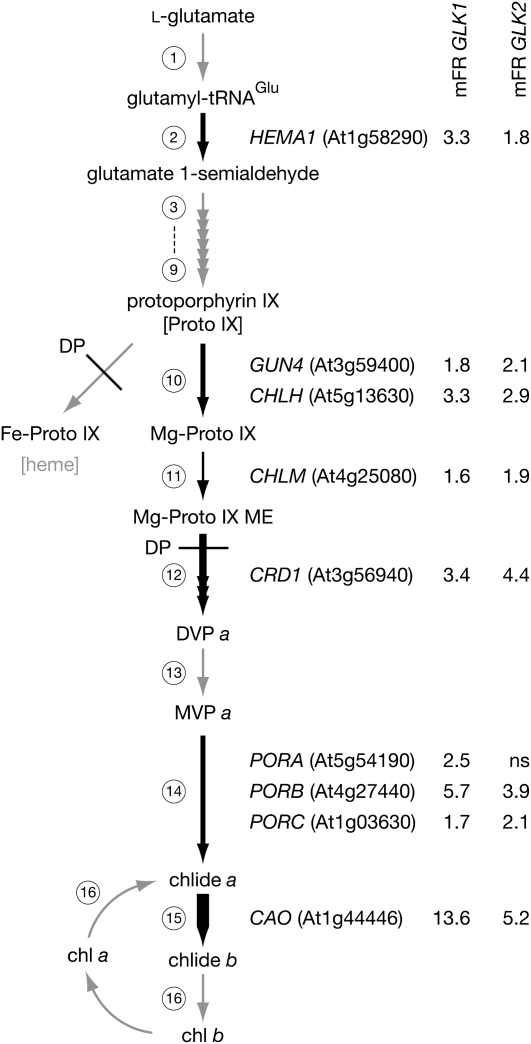
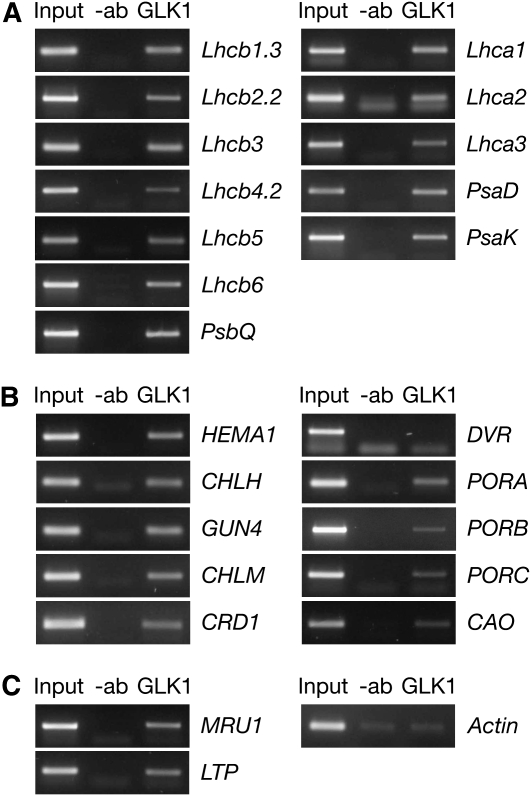
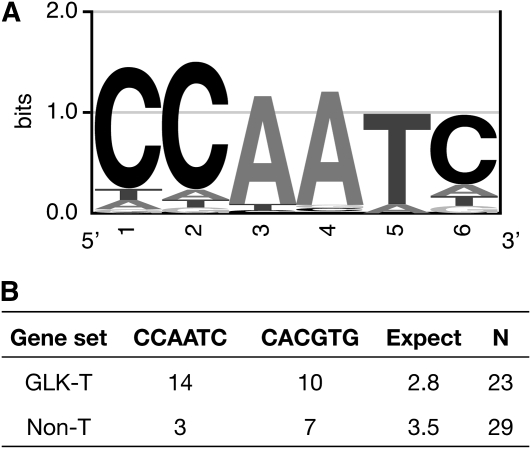
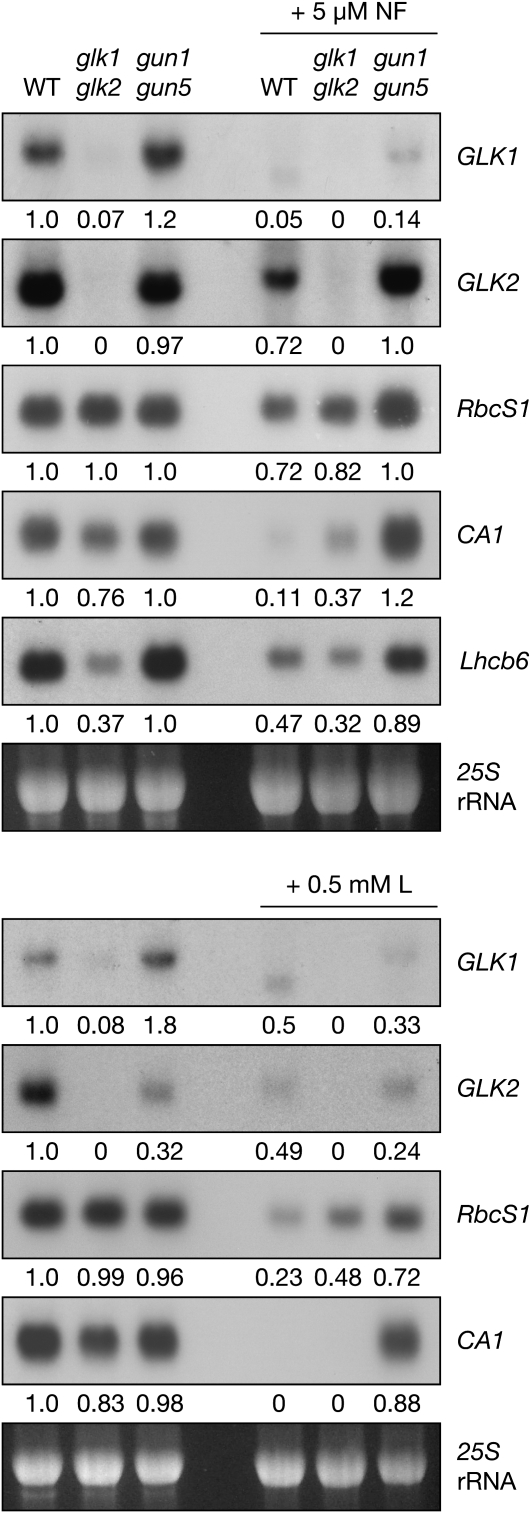
Chloroplasts of photosynthetic organisms harness light energy and convert it into chemical energy. In several land plants, GOLDEN2-LIKE (GLK) transcription factors are required for chloroplast development, as glk1 glk2 double mutants are pale green and deficient in the formation of the photosynthetic apparatus. We show here that glk1 glk2 double mutants of Arabidopsis thaliana accumulate abnormal levels of chlorophyll precursors and that constitutive GLK gene expression leads to increased accumulation of transcripts for antenna proteins and chlorophyll biosynthetic enzymes. To establish the primary targets of GLK gene action, an inducible expression system was used in combination with transcriptome analysis. Following induction, transcript pools were substantially enriched in genes involved in chlorophyll biosynthesis, light harvesting, and electron transport. Chromatin immunoprecipitation experiments confirmed the direct association of GLK1 protein with target gene promoters, revealing a putative regulatory cis-element. We show that GLK proteins influence photosynthetic gene expression independently of the phyB signaling pathway and that the two GLK genes are differentially responsive to plastid retrograde signals. These results suggest that GLK genes help to coregulate and synchronize the expression of a suite of nuclear photosynthetic genes and thus act to optimize photosynthetic capacity in varying environmental and developmental conditions.


Figures

Figure 1.
Figure 1.
Overexpression of GLK Genes Leads to Enhanced Transcript Levels of Nuclear Photosynthetic Genes. RNA gel blot analysis showing transcript levels in wild-type, double mutant (glk1 glk2), and double mutant lines overexpressing either GLK1 (35S:GLK1) or GLK2 (35S:GLK2). Plants were grown for 28 d under 30 or 100 μmol quanta·m−2·s−1 (low light and moderate light, respectively) at 21°C. All tissue samples were harvested within 20 min, starting at 3 h after subjective dawn. Ten micrograms of total RNA was loaded per lane. Blots were exposed to a phosphor-imager screen for quantification; images shown are subsequent exposures to autoradiography film. Values below each blot denote the approximate fold-change relative to the wild type grown under low light, standardized to 25S rRNA on the ethidium bromide–stained gel.
Figure 2.
Figure 2.
Dark-Grown glk1 glk2 Seedlings Exhibit Defects in the Chlorophyll Biosynthetic Pathway. (A) and (B) Transmission electron micrographs of etioplasts in the cotyledons of dark-grown 4-d-old wild type (A) and glk1 glk2 seedlings (B). Asterisk denotes the prolamellar body. Bars = 1 μm. (C) Levels of chlorophyll intermediates in dark-grown wild-type and glk1 glk2 seedlings as determined by spectrofluorometry. Top left panel: untreated seedlings. Excitation at 440 nm produces an emission peak at 632 nm corresponding to Pchlide. Top right panel: seedlings treated with 10 mM ALA. Excitation at 420 nm produces an emission peak at 595 nm corresponding to MgProtoIX (ME) and an additional, nonspecific peak at 632 nm corresponding to Pchlide and protoporphyrin IX (ProtoIX) (Pontier et al., 2007). Bottom panels: seedlings treated with 10 mM DP. In the bottom right panel, excitation at 400 nm produces an emission peak at 632 nm corresponding to ProtoIX. Bars to the right of each chart show quantification of the arrowed peak (mean ± se, n = 3 biological replicates). The wild type is represented with black bars and glk1 glk2 with gray bars.
Figure 3.
Figure 3.
Induction of GLK Expression Promotes Transcription of Photosynthesis-Related Genes. (A) RNA gel blot showing GLK1 and GLK2 transcript accumulation following induction. Four independent biological replicates (1 to 4) of seedlings carrying pOp6:GLK1 or pOp6:GLK2 transgenes were grown under a 16-h-light/8-h-dark cycle, induced 6 h after dawn with 10 μM DEX (+) or mock-treated with 0.1% DMSO (−), and then harvested 4 h later. Five micrograms of total RNA was loaded in each lane, and hybridization was quantified using a phosphor-imager. The induction ratio is calculated as (induced value)/(mock value) and expressed as a mean ± se (n = 4). (B) The mean fold ratio for the 20 most upregulated genes following GLK2 induction (blue) is plotted alongside the mean fold ratio for the same genes following GLK1 induction (red). Note that the GLK1-induced genes are generally more strongly affected than GLK2-induced genes. Error bars are sd (n ≥ 3 biological replicates). The table lists the 20 genes depicted in the chart; shaded cells correspond to photosynthetic/chloroplast-localized gene products and are described in the text. Supplemental Table 2 online lists all genes significantly changed in response to GLK2 induction and therefore lists the details of these top 20 genes. (C) The number of upregulated genes shared between induced pOp6:GLK1 and pOp6:GLK2 samples are represented by overlapping circles, the areas of which are proportional to the number of genes that pass the significance threshold. (D) Subcellular and subchloroplastic localization of gene products induced by GLK1. Gene products were assigned a location based on GO annotation. If unknown, the location was predicted by WoLF PSORT and assigned a location if this prediction was unambiguous. Unknown or ambiguous locations were excluded. GO annotations and assigned locations are listed in Supplemental Table 1 online. (E) Functional characterization of gene products induced by GLK1. Gene products were assigned a function based on GO annotation. GO annotations and assigned functions are listed in Supplemental Table 1 online.
Figure 4.
Figure 4.
Effect of GLK1 and GLK2 Induction on the Chlorophyll Biosynthetic Pathway. Schematic of the chlorophyll biosynthetic pathway with steps with significant changes in gene transcript levels following GLK induction depicted with black arrows; the relative strength of induction is reflected in the thickness of the arrow. Nonsignificantly changed steps and pathways are depicted with gray arrows. Values represent the mean fold ratio (mFR) change in gene expression (induced relative to noninduced) following induction of GLK1 and GLK2. For clarity, only genes with significantly changed transcript levels are shown for each step. Significance threshold of P ≤ 0.05, n ≥ 3 biological replicates. ns, not significant. Circled numbers refer to enzymatic steps listed in Supplemental Table 6 online, which details the changes in all genes involved in this pathway. Steps inhibited by DP are also shown. The genes are HEMA1; GUN4; CHLH; CHLM, Mg-protoporphyrin IX methyl transferase; CRD1, Mg-protoporphyrin IX monomethyl ester cyclase; PORA/PORB/PORC, protochlorophyllide oxidoreductase A/B/C; CAO; MgProtoME, magnesium protoporphyrin monomethyl ester; DVP, divinylprotochlorophyllide; and MVP, monovinylprotochlorophyllide.
Figure 5.
Figure 5.
Thylakoid-Associated Photosynthetic Components Significantly Upregulated following Induction of GLK1. Pictorial representation of PSI and PSII. The color scale depicts fold ratio in log2 units; a log2 fold ratio of 1 is equivalent to an absolute fold change of 2. Subunits showing a robust increase (>1) in corresponding transcript levels are highlighted in shades of red, with unchanged subunits in gray (<1). The significance threshold was P ≤ 0.01 (n ≥ 3). Note that only transcripts for nuclear-encoded proteins could be detected on the microarrays used. Subunits of PSI and PSII are referred to as Psa§ and Psb§, respectively, where § corresponds to the lettered labels in the figure. PC, plastocyanin. Gene IDs, significance levels, and mean fold ratios in absolute units for each subunit are listed in Supplemental Table 7 online. Figure redrawn with permission from J. Nield following the scheme at http://photosynthesis.sbcs.qmul.ac.uk/nield/psIIimages/oxygenicphotosynthmodel.html (accessed September 2, 2008).
Figure 6.
Figure 6.
Accumulation of Photosynthesis-Related Transcripts following GLK Induction. RNA gel blot analysis following GLK induction. Replicate sets of seedlings carrying either pOp6:GLK1 or pOp6:GLK2 were simultaneously treated with 10 μM DEX (+) or mock-treated with 0.1% DMSO (−) and harvested at the times shown. Seedlings were grown under a 16-h-light/8-h-dark cycle, and induction was performed 6 h after dawn. glk1 glk2 seedlings carrying the LhGR-N transgene were used as negative controls and harvested either immediately after addition of DEX (+0) or 24 h afterwards (+24). Ten micrograms of total RNA was loaded per lane, and replicate blots were probed and quantified using a phosphor imager. Values below each blot represent the fold ratio calculated as (induced value)/(mock value), after standardization to 25S rRNA on the ethidium bromide–stained gel.
Figure 7.
Figure 7.
GLK Proteins Bind the Promoter Sequences of Nuclear Photosynthetic Genes. PCR amplification of promoter sequences following ChIP assays. PSII and PSI genes (A), chlorophyll biosynthesis genes (B), and an actin negative control and two genes of unknown function, MRU1 (At5g35490) and LTP (At5g48490) (C). Sheared chromatin was subjected to immunoprecipitation with GLK1 antibody (+ab) or mock precipitated without antibody (−ab). Genomic DNA was used as a positive control (Input). Association of GLK1 with the promoter of a given gene is determined by enrichment of the PCR product in +ab compared with −ab lanes.
Figure 8.
Figure 8.
A Putative Promoter Binding Element of GLK Transcription Factors. (A) The first 500 bases upstream of the annotated transcriptional start site of 23 genes identified as positive by ChIP (Figure 7) were analyzed for potential consensus cis-elements using Weeder. The highest scoring six-base motif was CCAATC. All of the occurrences of CCAATC with one or fewer substitutions were used to generate a logo of the consensus sequence. The size of the letter at each position is scaled relative to the information content (a measure of conservation), reflecting the frequency of the corresponding base at each position. This logo is energy normalized using relative entropy to compensate for the low GC content in Arabidopsis. (B) The upstream 500 bases of the 23 GLK targets (GLK-T) and of 29 photosynthesis-related non-GLK targets (Non-T) were searched for the presence of the CCAATC and CACGTG motifs. The total number of perfect occurrences of each motif over all sequences is given in the table. “Expect” gives the number of expected occurrences of any 6-bp motif over the total sequence length considered, given an equiprobable distribution of nucleotides. Gene lists and a breakdown of element frequencies is provided in Supplemental Table 9 online.
Figure 9.
Figure 9.
GLK- and phyB-Derived Signals Act Independently upon Lhcb6 Expression. (A) Three-week-old, glasshouse-grown plants of the following genotypes (left to right): the wild type, glk1 glk2, phyB, and phyB glk1 glk2 (triple). (B) Total chlorophyll content (light gray) and chlorophyll a/b ratio (dark gray) of genotypes shown in (A). Error bars show mean ± se (n = 10 individual plants). (C) RNA gel blot analysis showing accumulation of Lhcb6 transcripts in seedlings of genotypes shown in (A). Etiolated seedlings were exposed to continuous white, red, or blue light or maintained in the dark for 16 h. Ten micrograms of total RNA was loaded per lane, and replicate blots were hybridized with Lhcb6 or 18S rRNA 32P-labeled DNA fragments and quantified with a phosphor imager. The chart shows Lhcb6 transcript levels, relative to 18s rRNA and standardized such that the wild type = 1 in each light treatment. Column heights denote the mean value from two experimental replicates, with the error bars showing the maximum and minimum values obtained across both replicates.
Figure 10.
Figure 10.
GLK Transcript Levels Are Sensitive to Plastid-Derived Retrograde Signals. RNA gel blot analysis showing accumulation of GLK1, GLK2, RbcS1, CA1, and Lhcb6 transcripts in response to inhibitor-induced plastid damage. Surface-sterilized seeds were sown on media supplemented with 5 μM NF (top panel) or 0.5 mM L (bottom panels). Ten micrograms of total RNA was loaded per lane, and replicate blots were hybridized with 32P-labeled DNA fragments. Blots were visualized by autoradiography and quantified by densitometry. Values below each blot denote the fold-change relative to the wild type grown without inhibitors, standardized to 25S rRNA on the ethidium bromide–stained gel. This experiment was performed twice with similar results.

Similar articles

Cited by

References

    1. Allen, J.F., and Forsberg, J. (2001). Molecular recognition in thylakoid structure and function. Trends Plant Sci. 6 317–326. - PubMed
    1. Anderson, J.M., Chow, W.S., and Park, Y.-I. (1995). The grand design of photosynthesis: Acclimation of the photosynthetic apparatus to environmental cues. Photosynth. Res. 46 129–139. - PubMed
    1. Armstrong, G.A., Runge, S., Frick, G., Sperling, U., and Apel, K. (1995). Identification of NADPH:protochlorophyllide oxidoreductases A and B: A branched pathway for light-dependent chlorophyll biosynthesis in Arabidopsis thaliana, Plant Physiol. 108 1505–1517. - PMC - PubMed
    1. Aseeva, E., Ossenbühl, F., Sippel, C., Cho, W.K., Stein, B., Eichacker, L.A., Meurer, J., Wanner, G., Westhoff, P., Soll, J., and Vothknecht, U.C. (2007). Vipp1 is required for basic thylakoid membrane formation but not for the assembly of thylakoid protein complexes. Plant Physiol. Biochem. 45 119–128. - PubMed
    1. Balk, J., and Lobrèaux, S. (2005). Biogenesis of iron-sulfur proteins in plants. Trends Plant Sci. 10 324–331. - PubMed

Publication types

MeSH terms