. 2009 Apr;21(4):1195-211.
doi: 10.1105/tpc.108.064774. Epub 2009 Apr 17.

The RNA binding protein ELF9 directly reduces SUPPRESSOR OF OVEREXPRESSION OF CO1 transcript levels in arabidopsis, possibly via nonsense-mediated mRNA decay

Affiliations

The RNA binding protein ELF9 directly reduces SUPPRESSOR OF OVEREXPRESSION OF CO1 transcript levels in arabidopsis, possibly via nonsense-mediated mRNA decay

Hae-Ryong Song et al. Plant Cell. 2009 Apr.

Abstract

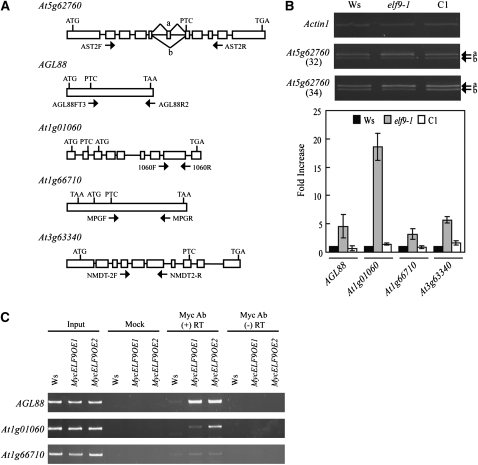
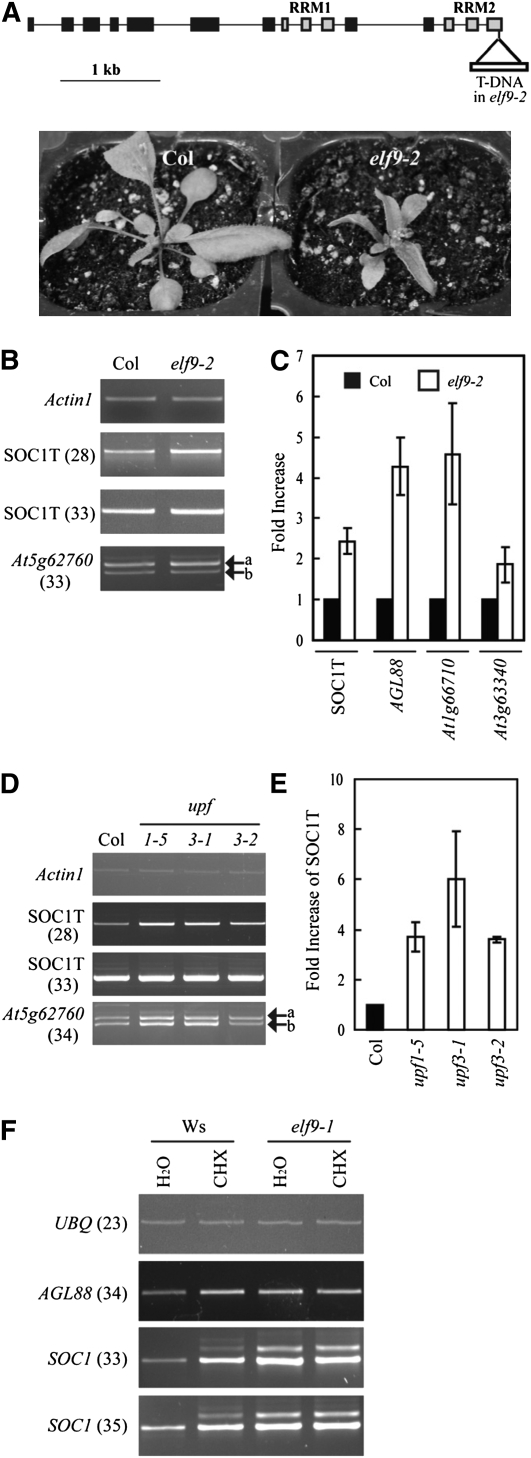
SUPPRESSOR OF OVEREXPRESSION OF CO1 (SOC1) is regulated by a complex transcriptional regulatory network that allows for the integration of multiple floral regulatory inputs from photoperiods, gibberellin, and FLOWERING LOCUS C. However, the posttranscriptional regulation of SOC1 has not been explored. Here, we report that EARLY FLOWERING9 (ELF9), an Arabidopsis thaliana RNA binding protein, directly targets the SOC1 transcript and reduces SOC1 mRNA levels, possibly through a nonsense-mediated mRNA decay (NMD) mechanism, which leads to the degradation of abnormal transcripts with premature translation termination codons (PTCs). The fully spliced SOC1 transcript is upregulated in elf9 mutants as well as in mutants of NMD core components. Furthermore, a partially spliced SOC1 transcript containing a PTC is upregulated more significantly than the fully spliced transcript in elf9 in an ecotype-dependent manner. A Myc-tagged ELF9 protein (MycELF9) directly binds to the partially spliced SOC1 transcript. Previously known NMD target transcripts of Arabidopsis are also upregulated in elf9 and recognized directly by MycELF9. SOC1 transcript levels are also increased by the inhibition of translational activity of the ribosome. Thus, the SOC1 transcript is one of the direct targets of ELF9, which appears to be involved in NMD-dependent mRNA quality control in Arabidopsis.


Figures

Figure 1.
Figure 1.
Early Flowering of elf9-1 in SDs and Identification of the ELF9 Gene. (A) Wild-type Ws and the elf9-1 mutant grown for 63 days (d) in sd. (B) Flowering time of Ws (black boxes) and elf9-1 (gray boxes) plants. Wild-type Ws and elf9-1 mutants were grown under SD and LD conditions, and their flowering times were determined as the number of rosette leaves present at bolting (leaf number). At least 10 individuals were scored for each genotype. Error bars represent sd. (C) Schematic diagram of the genomic structure of At5g16260. The T-DNA insertion site in the elf9-1 mutant is indicated. Gray boxes represent exons encoding two RRMs, and black boxes represent the other exons. Solid lines indicate introns. RRMs were predicted by SMART (http://smart.embl-heidelberg.de/). (D) Genomic complementation of elf9-1. C1 indicates one of the elf9-1 complementation lines containing a genomic At5g16260 fragment (see text for details). Plants were grown for 75 d in SDs. (E) Flowering time of three independent elf9-1 complementation lines (C1, C2, and C3), as scored by the number of rosette leaves formed at bolting. Plants were grown in SDs, and the data presented are averages ± sd of at least 12 individuals for each genotype. (F) Sequence comparison of the RRMs of ELF9, yeast CUS2, and human Tat-SF1. Each RRM is indicated by a solid line. The amino acid sequence alignment was generated using ClustalW (Thompson et al., 1994). Identical and similar amino acid residues are indicated by black and gray boxes, respectively.
Figure 2.
Figure 2.
Elevated Expression of SOC1 mRNA and Its Splicing Variant in elf9-1. (A) Expression of flowering genes in elf9-1. Ws and elf9-1 seedlings were grown under SD conditions for 15 d, harvested at ZT4 or ZT16, and used for RT-PCR analyses. UBQ was included as an expression control. The numbers in parentheses indicate amplification cycles ([A] and [B]). Identical results were obtained from two independent experiments, one of which is shown. (B) Diurnal expression of the SOC1 transcript in elf9-1. Seedlings were grown as in (A) and harvested every 4 h for RT-PCR analyses. SOC1F and SOC1R (Figure 4A; see Methods) were used to study SOC1 expression. Identical results were obtained from two independent experiments, one of which is shown. (C) Expression of full-length SOC1 transcript and its splicing variant in elf9-1. RNAs isolated from the ZT4 seedlings in (B) were used for RT-PCR analyses employing SOC1Fa and SOC1R (Figure 4A; see Methods) as PCR primers, with the indicated number of PCR cycles. (D) Quantification of SOC1T expression. SOC1T amplified from each genotype using the different PCR cycles in (C) was quantified and normalized based on the ZT4 UBQ in (B). The y axis indicates the relative abundance of SOC1T. Closed diamonds indicate SOC1T abundance in the wild type; open circles indicate SOC1T in elf9-1. (E) Quantification of SOC1V expression. Quantification and normalization were performed as in (D). (F) A greater increase in SOC1V than in SOC1T was observed in elf9-1 than in the wild type. Each quantity of SOC1V in (E) was divided by the corresponding quantity of SOC1T in (D), and the values were plotted on the y axis. Closed boxes represent the SOC1V/SOC1T ratios in the wild type; open boxes represent those in elf9-1.
Figure 3.
Figure 3.
SOC1 Transcriptional Activity Is Not Altered by the elf9-1 Mutation. (A) SOC1 promoter regions evaluated with the ChIP assay. The larger white box represents the first exonic 5′ UTR, and the smaller white box represents the second exonic 5′ UTR. The transcribed region within the second exon is indicated by the black box. Labeled lines indicate promoter regions amplified by primers (see Methods) during the ChIP assay. The location of the activation-tagging T-DNA inserted in soc1-101D FRI (Lee et al., 2000) is marked below the first exonic 5′ UTR. (B) ChIP assay of SOC1 chromatin with RNA PolII-specific antibody using Col FRI and soc1-101D FRI plants. “Input” indicates chromatin before immunoprecipitation. “Mock” refers to control samples lacking antibody. Actin1 was used as an internal control. (C) ChIP assay of SOC1 chromatin with RNA PolII-specific antibody using wild-type Ws and elf9-1 plants. (D) qPCR analysis of ChIP assays in (B) and (C). The levels of Col FRI and wild-type Ws were set to 1 after normalization against input chromatin. Error bars represent sd of three technical replicates.
Figure 4.
Figure 4.
SOC1V Contains the Unspliced Sixth Intron of SOC1. (A) Schematic representation of the SOC1 genomic region and alignment of SOC1T and SOC1V sequences around the 6th intron region, which is retained in SOC1V. The premature in-frame termination codon within SOC1V is underlined. The gray boxes in the front indicate exonic 5′ UTRs, and the rear gray box represents the 3′ UTR. The primers used for the RT-PCR analyses shown in Figures 2 and 4 are indicated. (B) Increased level of SOC1V in elf9-1, as measured by qPCR. SOC6INT, which is specific to the 6th intron of SOC1, and SOC1Fa were used for the specific detection of SOC1V. The wild-type Ws levels were set to 1 after normalization against UBQ expression. Error bars represent sd of three technical replicates. (C) Complementation of the increased expression of SOC1T and SOC1V in elf9-1 with genomic At5g16260. C1 and C2 are the two transgenic lines described in Figure 1E. Seedlings were grown in SD as described in Figure 2A and used for RNA isolation ([B]and [C]). The seedlings were harvested at ZT4. The numbers in parentheses indicate amplification cycles.
Figure 5.
Figure 5.
Genetic Interaction between SOC1 and ELF9. To measure the flowering time of the soc1-2 elf9-1 double mutant and compare it with those of soc1-2 (Col accession background; white bars) and elf9-1 (Ws accession background; black bars) single mutants, individuals in the segregated F2 population obtained by crossing soc1-2 and elf9-1 (gray bars) were directly genotyped and evaluated for changes in flowering time under LD conditions. Flowering time was determined as the number of rosette leaves present at bolting. Error bars indicate sd of at least 10 individuals for each genotype.
Figure 6.
Figure 6.
ELF9 Protein Binds SOC1 Transcript. (A) Schematic diagram of SOC1 pre-mRNA showing regions amplified by the primers (see Methods) used for IP-RT-PCR analysis. The two white boxes in the front represent the 5′ UTR, while the white box at the end indicates the 3′ UTR. Introns are represented by thin lines between the exons. Primer SOC1EX7R indicated below the 7th exon was used instead of an oligo(dT) primer for RT in this experiment. (B) ELF9 binding to SOC1 transcript. Fifteen-day-old transgenic seedlings harboring the CaMV35Spro:Myc:ELF9 fusion construct were harvested and immunoprecipitated with Myc-specific antibody. RT was performed using the eluates with SOC1EX7R as a primer (see Methods). Input: chromatin before immunoprecipitation. Mock: control samples lacking antibody. Myc Ab (+) RT: reverse transcribed with reverse transcriptase after immunoprecipitation with Myc antibody. Myc Ab (−) RT: reverse transcribed without reverse transcriptase after immunoprecipitation with Myc antibody.
Figure 7.
Figure 7.
Increased Expression of NMD Target Transcripts in elf9-1. (A) Schematic diagrams of the five PTC-containing genes (adopted from Hori and Watanabe, 2005; Arciga-Reyes et al., 2006) tested for NMD in elf9-1. ATGs indicate translation start codons, while TGAs or TAAs represent stop codons. Exons are indicated by boxes and introns by lines. The PTC site for each gene is marked. Arrows indicate the positions of the RT-PCR primers. The “a” and “b” indicate two alternatively spliced transcripts of At5g62760, namely, At5g62760a and At5g62760b, respectively. (B) RT-PCR or qPCR analysis of the PTC-containing genes shown in (A). The same RNAs used in Figure 4C were evaluated. C1 is one of the elf9-1 complementation lines described in Figures 1D, 1E, and 4C. Actin1 was used as an expression control. The numbers in parentheses indicate amplification cycles for RT-PCR analysis. The wild-type Ws levels were set to 1 after normalization against Actin1 for qPCR analysis. Error bars represent sd of three technical replicates. (C) ELF9 binding to the PTC-containing transcripts shown in (B). RNAs immunoprecipitated with Myc-specific antibody and purified (shown in Figure 6B) were reverse transcribed with an oligo(dT) primer. PCR was performed with the primers used in Figure 7B. Figure captions are as described in Figure 6B.
Figure 8.
Figure 8.
Increased Expression of SOC1T in elf9-2 and upf Mutants and by CHX. (A) Schematic diagram of the genomic structure of ELF9 and the phenotypes of elf9-2. The T-DNA insertion site in the elf9-2 mutant is indicated. Schematic is as described in Figure 1C. Wild-type Col and the elf9-2 mutant plants were grown for 28 d in LDs. (B) RT-PCR analysis of SOC1 and At5g62760 expression in elf9-2. Col and elf9-2 plants were grown in LDs for 28 d, harvested at ZT8, and used for RNA extraction. SOC1Fa and SOC1R were used as PCR primers to amplify SOC1 ([B] to [F]). Actin1 was included as an expression control. Identical results were obtained from two independent experiments, one of which is shown. (C) qPCR analysis of the PTC-containing genes. The same RNAs used in (B) were evaluated. The wild-type Col levels were set to 1 after normalization against Actin1 for qPCR analysis. Error bars represent sd of three technical replicates. (D) RT-PCR analysis of SOC1 and At5g62760 expression in upf1-5, upf3-1, and upf3-2 mutants. The wild-type Col, upf1-5, upf3-1, and upf3-2 plants were grown in LDs for 20 d, harvested at ZT8, and used for RNA extraction. Actin1 was included as an expression control. Identical results were obtained from two independent experiments, one of which is shown. (E) qPCR analysis of SOC1T expression. The same RNAs used in (D) were evaluated. The wild-type Col levels were set to 1 after normalization against Actin1 for qPCR analysis. Error bars represent sd of three technical replicates. (F) Increased expression of SOC1 transcripts by CHX treatment. See Methods for details. UBQ was included as an expression control. Identical results were obtained from two independent experiments, one of which is shown.

Similar articles

Cited by

References

    1. Abe, M., Kobayashi, Y., Yamamoto, S., Daimon, Y., Yamaguchi, A., Ikeda, Y., Ichinoki, H., Notaguchi, M., Goto, K., and Araki, T. (2005). FD, a bZIP protein mediating signals from the floral pathway integrator FT at the shoot apex. Science 309 1052–1056. - PubMed
    1. Arciga-Reyes, L., Wootton, L., Kieffer, M., and Davies, B. (2006). UPF1 is required for nonsense-mediated mRNA decay (NMD) and RNAi in Arabidopsis. Plant J. 47 480–489. - PubMed
    1. Ausin, I., Alonso-Blanco, C., Jarillo, J.A., Ruiz-Garcia, L., and Martinez-Zapater, J.M. (2004). Regulation of flowering time by FVE, a retinoblastoma-associated protein. Nat. Genet. 36 162–166. - PubMed
    1. Bäurle, I., and Dean, C. (2006). The timing of developmental transitions in plants. Cell 125 655–664. - PubMed
    1. Bezerra, I.C., Michaels, S.D., Schomburg, F.M., and Amasino, R.M. (2004). Lesions in the mRNA cap-binding gene ABA HYPERSENSITIVE 1 suppress FRIGIDA-mediated delayed flowering in Arabidopsis. Plant J. 40 112–119. - PubMed

Publication types

MeSH terms