. 2009 Jun;19(6):1133-40.
doi: 10.1101/gr.088120.108. Epub 2009 Apr 17.

High resolution mapping of expression QTLs in heterogeneous stock mice in multiple tissues

Affiliations

High resolution mapping of expression QTLs in heterogeneous stock mice in multiple tissues

Guo-Jen Huang et al. Genome Res. 2009 Jun.

Abstract

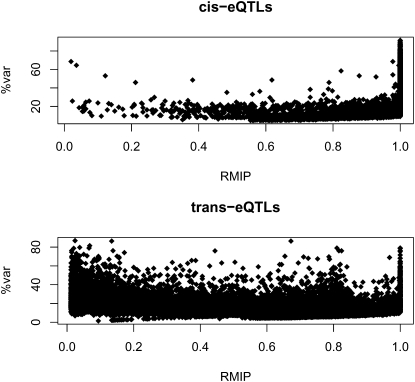
A proportion of the genetic variants underlying complex phenotypes do so through their effects on gene expression, so an important challenge in complex trait analysis is to discover the genetic basis for the variation in transcript abundance. So far, the potential of mapping both quantitative trait loci (QTLs) and expression quantitative trait loci (eQTLs) in rodents has been limited by the low mapping resolution inherent in crosses between inbred strains. We provide a megabase resolution map of thousands of eQTLs in hippocampus, lung, and liver samples from heterogeneous stock (HS) mice in which 843 QTLs have also been mapped at megabase resolution. We exploit dense mouse SNP data to show that artifacts due to allele-specific hybridization occur in approximately 30% of the cis-acting eQTLs and, by comparison with exon expression data, we show that alternative splicing of the 3' end of the genes accounts for <1% of cis-acting eQTLs. Approximately one third of cis-acting eQTLs and one half of trans-acting eQTLs are tissue specific. We have created an important systems biology resource for the genetic analysis of complex traits in a key model organism.


Figures

Figure 1.
Figure 1.
(A) The number of cis-eQTLs for each of three tissues at different RMIP thresholds (vertical axis). Numbers are shown for cis-eQTLs containing no annotated SNPs (crosses) and for all cis-eQTLs (diamonds). Lung data are shown in blue, liver in green, and hippocampus in red (260 animals) and black (460 animals). (B) The number of trans-eQTLs for each of three tissues at different RMIP thresholds (vertical axis). Lung data are shown in blue, liver in green, and hippocampus in red (260 animals) and black (460 animals).
Figure 2.
Figure 2.
Relationship between the RMIP and effect size (expressed as percentage of the variation in transcript level [%var]) for cis- and trans-eQTLs.
Figure 3.
Figure 3.
Effect of sequence variants on cis-eQTL detection. The frequency (vertical axis) of logP (negative logarithm of the P-value) scores (horizontal axis) for cis-acting eQTLs is shown. Data for cis-eQTLs with no annotated variant (solid line) are compared with data for cis-eQTLs with terminal variants (a SNP in the first two or last base pairs of the probe sequence) and with central variants (defined as any SNP that is not a terminal variant).
Figure 4.
Figure 4.
Splicing variants. Predicted transcript isoforms for four genes (Soat1, Tbc1d24, Gna13, and Zscan21) are shown on the left, based on the exon-array data. Each dot is the average of three measurements of the probe set signal intensity for one of the eight inbred strains. A gray horizontal bar identifies probe sets judged to show significant variation between the strains. RefSeq and Ensembl predicted gene structure are taken from the UCSC Genome Browser (http://www.genome.ucsc.edu). Exon PCR results are shown on the right. In two cases (Gna13 and Tbc1d24) PCR primers amplify across a single terminal exon. For Soat1 and Zscan21 primers were designed that amplify flanking exons. Each mouse inbred strain is indicated by a different color. Strain names are as follows: C57, C57BL/6J; AJ, A/J; C3H, C3H/HeJ; DBA, DBA/2J; CBA, CBA/J; BALB, BALBc/J; LP, LP/J; AK, AKR/J. The PCR results suggest the following as an explanation for the inbred strains differences in exon-specific hybridization signal: (1) exon skipping of the second exon of Soat1 in AKR/J (AK, red diamond); (2) newly identified spliced introns within 5′ UTR of Tbc1d24 in all strains except for C57BL/6J (C57, yellow); (3) newly identified spliced intron within the 3′ UTR of Gna13 in BALBc/J (BALB, dark green); (4) alternative splicing by exon skipping of the second exon of Zscan21 in all strains except for C57BL/6J and AKR/J (C57; yellow; AK, red).
Figure 5.
Figure 5.
Bootstrap derived 95% confidence of cis- and trans-eQTLs plotted against their respective logP. The size of the interval is shown on the vertical axis in megabases, and the ANOVA logP on the horizontal axis. Trans-eQTLs are shown as open circles, cis-eQTLs as filled circles. A regression curve fitted to the square root of the confidence interval is shown for trans-eQTLs (dotted) and cis-eQTLS (continuous).

Similar articles

Cited by

References

    1. Alberts R., Terpstra P., Li Y., Breitling R., Nap J.P., Jansen R.C. Sequence polymorphisms cause many false cis eQTLs. PLoS One. 2007;2:e622. doi: 10.1371/journal.pone.0000622. - DOI - PMC - PubMed
    1. Belknap J.K., Mitchel S.R., Crabbe J.C. Type I and II error rates for quantitative trait loci (QTL) mapping studies using recombinant inbred mouse strains: Computer simulation and empirical results. Behav. Genet. 1996;26:149–160. - PubMed
    1. Benovoy D., Kwan T., Majewski J. Effect of polymorphisms within probe-target sequences on olignonucleotide microarray experiments. Nucleic Acids Res. 2008;36:4417–4423. - PMC - PubMed
    1. Brem R.B., Kruglyak L. The landscape of genetic complexity across 5700 gene expression traits in yeast. Proc. Natl. Acad. Sci. 2005;102:1572–1577. - PMC - PubMed
    1. Bystrykh L., Weersing E., Dontje B., Sutton S., Pletcher M.T., Wiltshire T., Su A.I., Vellenga E., Wang J., Manly K.F., et al. Uncovering regulatory pathways that affect hematopoietic stem cell function using “genetical genomics.”. Nat. Genet. 2005;37:225–232. - PubMed

Publication types

MeSH terms