

Adaptive echolocation behavior in bats for the analysis of auditory scenes
- PMID: 19376960
- PMCID: PMC2726850
- DOI: 10.1242/jeb.027045
Adaptive echolocation behavior in bats for the analysis of auditory scenes
Abstract
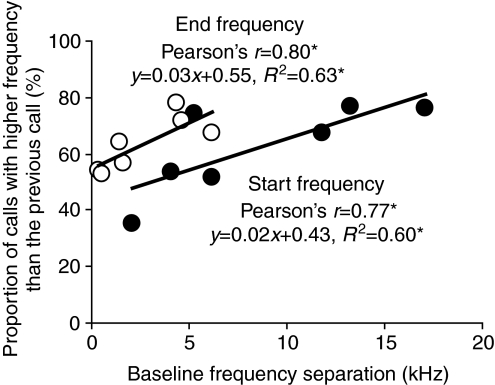
Echolocating bats emit sonar pulses and listen to returning echoes to probe their surroundings. Bats adapt their echolocation call design to cope with dynamic changes in the acoustic environment, including habitat change or the presence of nearby conspecifics/heterospecifics. Seven pairs of big brown bats, Eptesicus fuscus, were tested in this study to examine how they adjusted their echolocation calls when flying and competing with a conspecific for food. Results showed that differences in five call parameters, start/end frequencies, duration, bandwidth and sweep rate, significantly increased in the two-bat condition compared with the baseline data. In addition, the magnitude of spectral separation of calls was negatively correlated with the baseline call design differences in individual bats. Bats with small baseline call frequency differences showed larger increases in call frequency separation when paired than those with large baseline call frequency differences, suggesting that bats actively change their sonar call structure if pre-existing differences in call design are small. Call design adjustments were also influenced by physical spacing between two bats. Calls of paired bats exhibited the largest design separations when inter-bat distance was shorter than 0.5 m, and the separation decreased as the spacing increased. All individuals modified at least one baseline call parameter in response to the presence of another conspecific. We propose that dissimilarity between the time-frequency features of sonar calls produced by different bats aids each individual in segregating echoes of its own sonar vocalizations from the acoustic signals of neighboring bats.
Figures


Similar articles
-
Echolocating bats rely on audiovocal feedback to adapt sonar signal design.Proc Natl Acad Sci U S A. 2017 Oct 10;114(41):10978-10983. doi: 10.1073/pnas.1711892114. Epub 2017 Sep 25. Proc Natl Acad Sci U S A. 2017. PMID: 28973851 Free PMC article.
-
Adaptive vocal behavior drives perception by echolocation in bats.Curr Opin Neurobiol. 2011 Aug;21(4):645-52. doi: 10.1016/j.conb.2011.05.028. Epub 2011 Jun 24. Curr Opin Neurobiol. 2011. PMID: 21705213 Free PMC article. Review.
-
Natural echolocation sequences evoke echo-delay selectivity in the auditory midbrain of the FM bat, Eptesicus fuscus.J Neurophysiol. 2018 Sep 1;120(3):1323-1339. doi: 10.1152/jn.00160.2018. Epub 2018 Jun 20. J Neurophysiol. 2018. PMID: 29924708
-
Flying in silence: Echolocating bats cease vocalizing to avoid sonar jamming.Proc Natl Acad Sci U S A. 2008 Sep 2;105(35):13116-21. doi: 10.1073/pnas.0804408105. Epub 2008 Aug 25. Proc Natl Acad Sci U S A. 2008. PMID: 18725624 Free PMC article.
-
Bat echolocation calls: adaptation and convergent evolution.Proc Biol Sci. 2007 Apr 7;274(1612):905-12. doi: 10.1098/rspb.2006.0200. Proc Biol Sci. 2007. PMID: 17251105 Free PMC article. Review.
Cited by
-
Timing matters: sonar call groups facilitate target localization in bats.Front Physiol. 2014 May 12;5:168. doi: 10.3389/fphys.2014.00168. eCollection 2014. Front Physiol. 2014. PMID: 24860509 Free PMC article.
-
Echolocating bats rely on audiovocal feedback to adapt sonar signal design.Proc Natl Acad Sci U S A. 2017 Oct 10;114(41):10978-10983. doi: 10.1073/pnas.1711892114. Epub 2017 Sep 25. Proc Natl Acad Sci U S A. 2017. PMID: 28973851 Free PMC article.
-
Adaptive vocal behavior drives perception by echolocation in bats.Curr Opin Neurobiol. 2011 Aug;21(4):645-52. doi: 10.1016/j.conb.2011.05.028. Epub 2011 Jun 24. Curr Opin Neurobiol. 2011. PMID: 21705213 Free PMC article. Review.
-
Suppression of emission rates improves sonar performance by flying bats.Sci Rep. 2017 Jan 31;7:41641. doi: 10.1038/srep41641. Sci Rep. 2017. PMID: 28139707 Free PMC article.
-
Big brown bats (Eptesicus fuscus) reveal diverse strategies for sonar target tracking in clutter.J Acoust Soc Am. 2016 Sep;140(3):1839. doi: 10.1121/1.4962496. J Acoust Soc Am. 2016. PMID: 27914429 Free PMC article.
References
-
- Balcombe, J. P. (1990). Vocal recognition of pups by mother Mexican free-tailed bats, Tadarida brasiliensis mexicana. Anim. Behav. 39, 960-966.
-
- Bartonička, T., Řehák, Z. and Gaisler, J. (2007). Can pipistrelles, Pipistrellus pipistrellus (Schreber, 1774) and Pipistrellus pygmaeus (Leach, 1825), foraging in a group, change parameters of their signals? J. Zool. Lond. 272, 194-201.
-
- Bates, M. E., Stamper, S. A. and Simmons, J. A. (2008). Jamming avoidance response of big brown bats in target detection. J. Exp. Biol. 211, 106-113. - PubMed
-
- Bregman, A. S. (1990). Auditory Scene Analysis: The Perceptual Organization of Sound. Cambridge, MA: MIT Press.
Publication types
MeSH terms
Grants and funding
LinkOut - more resources
Full Text Sources
Miscellaneous
