. 2009 May 5;106(18):7397-402.
doi: 10.1073/pnas.0806742106. Epub 2009 Apr 17.

PPARalpha blocks glucocorticoid receptor alpha-mediated transactivation but cooperates with the activated glucocorticoid receptor alpha for transrepression on NF-kappaB

Affiliations

PPARalpha blocks glucocorticoid receptor alpha-mediated transactivation but cooperates with the activated glucocorticoid receptor alpha for transrepression on NF-kappaB

Nadia Bougarne et al. Proc Natl Acad Sci U S A. .

Abstract

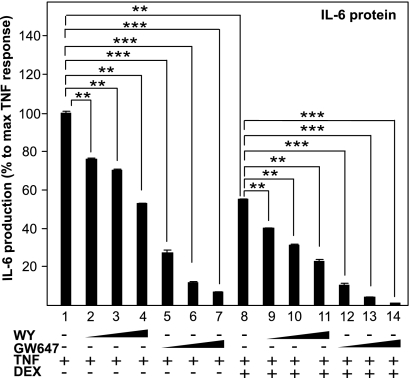
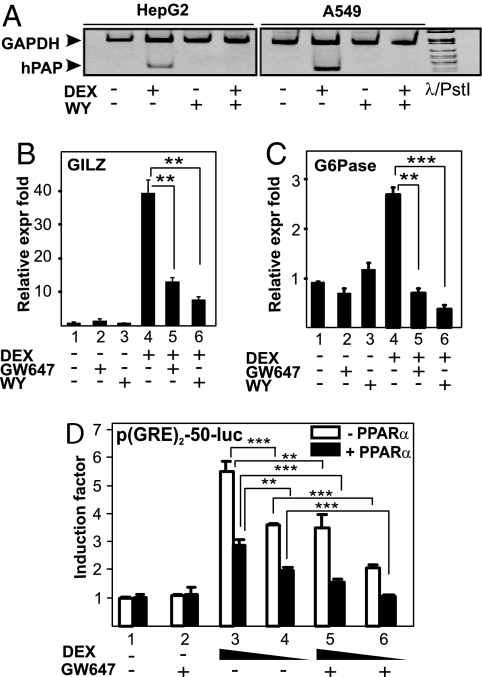
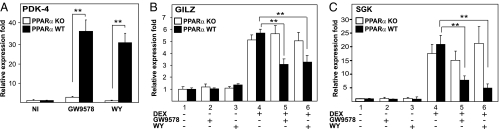
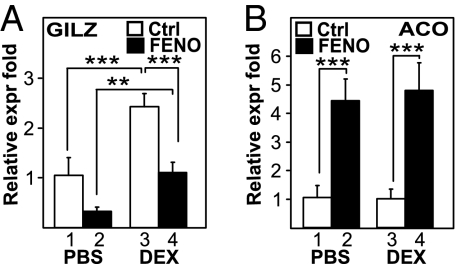
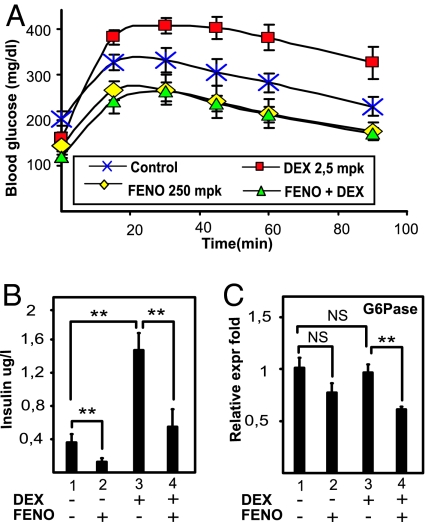
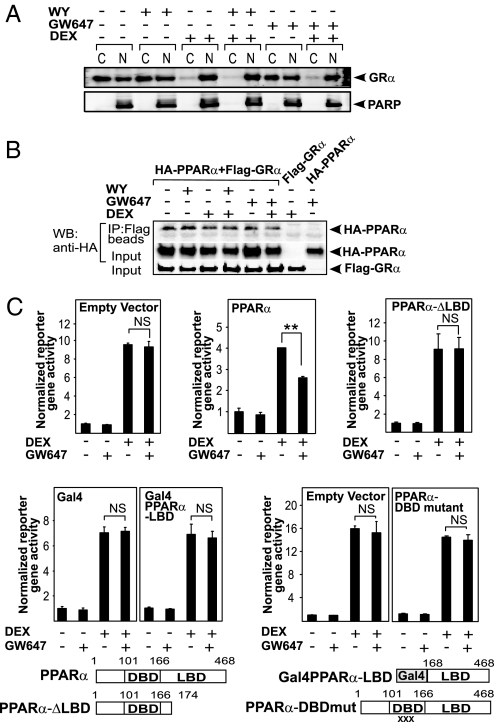
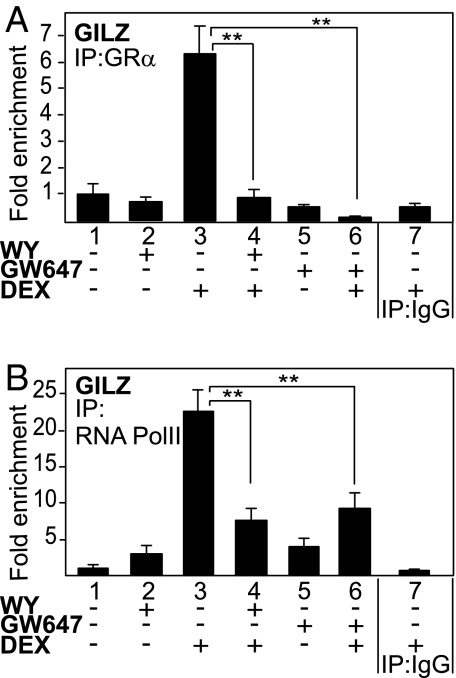
Glucocorticoid receptor alpha (GRalpha) and peroxisome proliferator-activated receptor alpha (PPARalpha) are transcription factors with clinically important immune-modulating properties. Either receptor can inhibit cytokine gene expression, mainly through interference with nuclear factor kappaB (NF-kappaB)-driven gene expression. The present work aimed to investigate a functional cross-talk between PPARalpha- and GRalpha-mediated signaling pathways. Simultaneous activation of PPARalpha and GRalpha dose-dependently enhances transrepression of NF-kappaB-driven gene expression and additively represses cytokine production. In sharp contrast and quite unexpectedly, PPARalpha agonists inhibit the expression of classical glucocorticoid response element (GRE)-driven genes in a PPARalpha-dependent manner, as demonstrated by experiments using PPARalpha wild-type and knockout mice. The underlying mechanism for this transcriptional antagonism relies on a PPARalpha-mediated interference with the recruitment of GRalpha, and concomitantly of RNA polymerase II, to GRE-driven gene promoters. Finally, the biological relevance of this phenomenon is underscored by the observation that treatment with the PPARalpha agonist fenofibrate prevents glucocorticoid-induced hyperinsulinemia of mice fed a high-fat diet. Taken together, PPARalpha negatively interferes with GRE-mediated GRalpha activity while potentiating its antiinflammatory effects, thus providing a rationale for combination therapy in chronic inflammatory disorders.


Conflict of interest statement

The authors declare no conflict of interest.

Figures

Fig. 1.
Fig. 1.
PPARα agonists and GCs cooperatively inhibit IL-6. L929sA cells with stably integrated p(IL6κB)350hu.IL6P-luc+ were preincubated with solvent, DEX (0.01 μM), GW647(1, 0.5, or 0.25 μM), WY (2, 5, or 10 μM) or various combinations thereof, for 1 h, before TNF (200 units/mL) was added, where indicated, for 24 h. Medium was collected to perform a murine IL-6 ELISA. Protein levels obtained in nanograms per milliliter are calculated as percentage of maximum TNF response. Results are shown ± SD. **, P < 0.01; ***, P < 0.001. The luc assays are shown in Fig. S1A.
Fig. 2.
Fig. 2.
PPARα agonists efficiently block GRE-driven gene expression. A549 (A), HepG2 (A and B) and FTO2B (C) cells were treated with solvent, DEX (1 μM), GW9578 (500 nM), or WY (10 μM) or various combinations for 8 h (A) or 3 h (B and C). mRNA was isolated and reverse transcribed, and cDNA was subjected either to semiquantitative PCR analysis (A) with primers to detect GAPDH (loading control) or hPAP in the same sample, or to SYBR green QPCR (B and C) with primers to detect G6Pase or GILZ. QPCR measurements were performed in triplicate. QPCR results, normalized to expression of household genes, are shown ± SD. Results are represented as relative expression fold, i.e., with the solvent-treated control value taken as 1. (D) HepG2 cells were transiently transfected with p(GRE)2-50-luc and pSG5PPARα (filled bars) or pSG5 (open bars). Twenty-four hours later, cells were treated with solvent, DEX (1 or 0.1 μM), GW647 (500 nM), or various combinations, for a total period of 8 h. Cell lysates were assayed for luc activities and normalized for β-gal activities. Promoter activities are expressed as relative induction factor, i.e., the ratio of expression levels of induced versus noninduced conditions.
Fig. 3.
Fig. 3.
PPARα agonist-mediated inhibition of GC-induced gene expression is PPARα dependent. (A) Primary hepatocytes isolated from PPARα KO mice (open bars) or from WT mice (filled bars) were treated with solvent or GW9578 (500 nM) or WY (10 μM) for 24 h. mRNA was isolated, reverse transcribed, and subjected to QPCR with primers to detect PDK-4. (B) Primary hepatocytes from PPARα KO mice (open bars) or from WT mice (filled bars) were treated with solvent, GW9578 (500 nM), WY (10 μM), DEX (1 μM), or various combinations thereof, as indicated, for 24 h. mRNA was isolated, reverse transcribed, and subjected to QPCR by using primers to detect GILZ or SGK1 (B and C, respectively). QPCR measurements were performed in triplicate, and the normalized results are represented as expression folds, i.e., taking the control value as 1 and shown ± SD.
Fig. 4.
Fig. 4.
Activation of PPARα inhibits GC-induced gene expression in vivo. Groups of 6 mice per group, randomized according to their weight, were treated with either DEX (10 mg/kg, i.p.) or an equal volume of normal saline, and/or FENO (200 mg/kg, gavage) or an equal volume of 0.5% CMC (control) every day for a period of 5 days. GILZ (A) and ACO (B) mRNA expression levels from the liver were quantified via QPCR and normalized for household gene expression. Results from triplicate experiments are shown ± SD. Results are represented as relative expression fold, i.e., with the solvent-treated control value taken as 1.
Fig. 5.
Fig. 5.
Activation of PPARα counteracts GC-induced Glc intolerance in vivo. (A) Groups of 6 mice per group with an acquired hyperinsulinemia through the intake of a high-fat diet for 7 weeks were daily treated with either PBS (control), DEX (2,5 mg/kg), FENO (200 mg/kg), or DEX/FENO combined, for 7 days, after which an IPGTT was performed, measuring blood Glc levels before and 15, 30, 45, 60, and 90 min after a Glc injection. Results are shown ± SD. *, P < 0.05. (B) Insulin levels from the different groups were measured after 16 h of fasting. (C) Liver G6Pase mRNA expression levels were quantified by QPCR and normalized for household gene expressions. Results from triplicate experiments are shown ± SD.
Fig. 6.
Fig. 6.
Multiple domains of PPARα are involved in a functional interference with GRE-driven gene expression. (A) After serum starvation in phenol red-free medium for 24 h, BWTG3 cells were treated with solvent (NI) or induced with DEX (1 μM), WY (50 μM), GW647 (500 nM), or various combinations thereof for 1 h upon which cells were subjected to a cellular fractionation assay. Western blot analysis was performed by using an anti-GR Ab. Simultaneous probing with an anti-PARP Ab served as a control for the fractionation efficiency. The displayed bands were blotted onto two different membranes. C, cytoplasmic; N, nuclear. (B) Equal amounts of differently tagged receptor variants were transfected in HEK293T cells. Cells were stimulated as indicated in the figure followed by coimmunoprecipitation analysis of the nuclear fraction using anti-FLAG beads and immunoblotting with an anti-HA antibody. Input controls for FLAG-GRα and HA-PPARα were verified by Western blot analysis using anti-FLAG and anti-HA, respectively. A representative of two independent experiments is shown. (C) Equal amounts of the corresponding empty vectors or PPARα receptor variants were transfected together with p(GRE)2-50-luc, pSVhGRα, and the β-galactosidase-expressing plasmid in HEK293T cells. Cells were stimulated for 8 h. Cell lysates were assayed for luc activities and normalized for β-gal activities. Promoter activities are expressed as relative induction factor, i.e., the ratio of expression levels of induced versus noninduced conditions. A representative of 4 independent experiments is shown. XXX marks the triple-point mutations D140C/R141D/S142A.
Fig. 7.
Fig. 7.
PPARα agonists interfere with the recruitment of GRα onto the GRE-driven GILZ promoter. After serum starvation for 48 h, A549 cells were incubated with solvent, DEX (1 μM), WY (50 μM), GW647 (500 nM), or various combinations for 2 h. Cross-linked and sonicated cell lysates were subjected to ChIP analysis against GR (A) or RNA pol II (B). QPCR was used to assay recruitment at the GILZ gene promoter. The quantity of GR or RNA pol II detected on the GILZ promoter is shown with a correction of the SYBR Green QPCR signal for input control. Lanes 1–6 are performed with the specific Ab, as indicated in the graph; lane 7 includes the IgG control. The reaction was performed in triplicate.

Similar articles

Cited by

References

    1. De Bosscher K, Vanden Berghe W, Haegeman G. The interplay between the GR and NF-κB or AP-1: Molecular mechanisms for gene repression. Endocr Rev. 2003;24:488–522. - PubMed
    1. Shiri-Sverdlov R, et al. Early diet-induced non-alcoholic steatohepatitis in APOE2 knockin mice and its prevention by fibrates. J Hepatol. 2006;44:732–741. - PubMed
    1. Desvergne B, Wahli W. PPARs: Nuclear control of metabolism. Endocr Rev. 1999;20:649–688. - PubMed
    1. Delerive P, et al. PPARα negatively regulates the vascular inflammatory gene response by negative cross-talk with transcription factors NF-κB and AP-1. J Biol Chem. 1999;274:32048–32054. - PubMed
    1. Staels B, et al. Activation of human aortic smooth-muscle cells is inhibited by PPARα but not by PPARγ activators. Nature. 1998;393:790–793. - PubMed

Publication types

MeSH terms

LinkOut - more resources