. 2009 May;15(5):572-6.
doi: 10.1038/nm.1919. Epub 2009 Apr 19.

The parametric response map is an imaging biomarker for early cancer treatment outcome

Affiliations

The parametric response map is an imaging biomarker for early cancer treatment outcome

Craig J Galbán et al. Nat Med. 2009 May.

Abstract

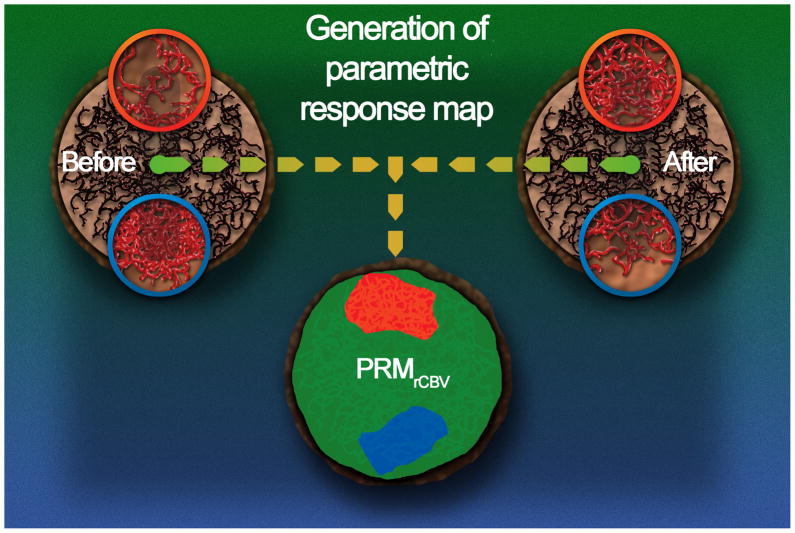
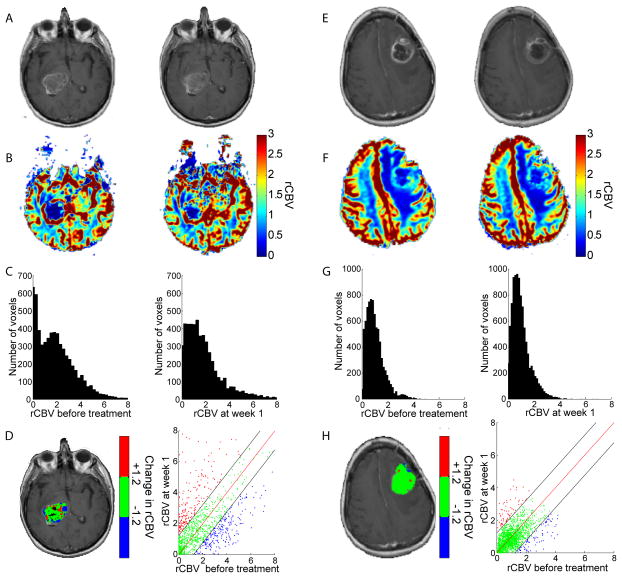
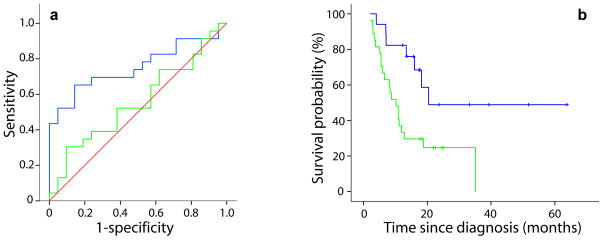
Here we describe the parametric response map (PRM), a voxel-wise approach for image analysis and quantification of hemodynamic alterations during treatment for 44 patients with high-grade glioma. Relative cerebral blood volume (rCBV) and flow (rCBF) maps were acquired before treatment and after 1 and 3 weeks of therapy. We compared the standard approach using region-of-interest analysis for change in rCBV or rCBF to the change in perfusion parameters on the basis of PRM (PRM(rCBV) and PRM(rCBF)) for their accuracy in predicting overall survival. Neither the percentage change of rCBV or rCBF predicted survival, whereas the regional response evaluations made on the basis of PRM were highly predictive of survival. Even when accounting for baseline rCBV, which is prognostic, PRM(rCBV) proved more predictive of overall survival.


Conflict of interest statement

COMPETING INTEREST STATEMENT

BDR, AR, CJG, CRM and TLC have a financial interest in the underlying technology. BDR and AR also have a financial interest in ImBio, LLC which has licensed the underlying PRM technology.

Figures

Figure 1
Figure 1
PRM is a fundamentally distinct approach from the region of interest method in that it retains spatial alterations in perfusion values early following treatment initiation. This quantification method relies upon a voxel-by-voxel comparison of perfusion maps through image co-registration of pre-treatment images with those obtained at short time intervals following treatment initiation in an effort to provide early assessment of treatment outcome. As illustrated in this figure, the tumor environment may have three local hemodynamic outcomes throughout the course of therapy. An increase in rCBV above a specified threshold suggests a significant increase in the microvascular density or enlargement of blood vessel diameter (i.e. blood volume) within the tumor, in which case these voxels would be color coded red in the PRM analysis approach applied to rCBV (PRMrCBV). Alternatively, treatment may result in a significant reduction in rCBV within the tumor in which case voxels within those regions would be coded blue. Voxels in regions which were relatively unaffected by therapy would be coded green. The PRMrCBV analysis retains the spatial rCBV information as coded by color overlay on anatomic Gd-enhanced T1-weighted images and also quantification of the total number of tumor voxels (on a percentage of total tumor volume) which exhibited an increase (red: PRMrCBV+), decrease (blue: PRMrCBV−) or unchanged (green: PRMrCBV0) rCBV values using scatter plot analysis. This quantification of spatially altered rCBV values provided the opportunity to evaluate the PRM approach as a prognostic imaging biomarker for early treatment response assessment through correlation with overall survival.
Figure 2
Figure 2
Individuals with a glioblastoma multiforme designated by PRMrCBV− stratification as a non-responder (a–d; survival time of 2.9 months) and responder (e–h; survival time of 20.4 months). (a,e) Gd-enhanced T1-weighted MR images, (b,f) rCBV with color scale and (c,g) rCBV histograms of tumor, at 0 (left panels) and 1 (right panels) week post-therapy. Representative slices of (d,h) PRMrCBV color-coded ROI superimposed onto a Gd-enhanced T1-weighted MR image pre-therapy and scatter plot showing the distribution of rCBV pre and post-therapy for the entire 3-dimensional tumor volume. Unity and 95% confidence intervals within the scatter plot are designated by a red and two black lines, respectively. Voxels with significantly increasing, decreasing or unchanged rCBV are designated by red, blue and green dots. Voxels in which the perfusion model had generated erroneous results were colored black on the PRM overlay and were not included in the whole-tumor or PRM analyses.
Figure 3
Figure 3
(a) ROC curves for PRMrCBV− (blue line) and percentage change of rCBV (green line) at week 1 post-treatment. (b) Kaplan-Meier survival plots for overall survival are presented as a function of PRMrCBV− stratification at weeks 1 post-treatment initiation. Blue lines indicates PRMrCBV− ≤ cutoff and green lines indicates PRMrCBV− > cutoff.

References

    1. O’Connor JP, Jackson A, Parker GJ, Jayson GC. DCE-MRI biomarkers in the clinical evaluation of antiangiogenic and vascular disrupting agents. Br J Cancer. 2007;96:189–195. - PMC - PubMed
    1. Zahra MA, Hollingsworth KG, Sala E, Lomas DJ, Tan LT. Dynamic contrast-enhanced MRI as a predictor of tumour response to radiotherapy. Lancet Oncol. 2007;8:63–74. - PubMed
    1. Cao Y, et al. Clinical investigation survival prediction in high-grade gliomas by MRI perfusion before and during early stage of RT. Int J Radiat Oncol Biol Phys. 2006;64:876–885. - PubMed
    1. Ostergaard L, Weisskoff RM, Chesler DA, Gyldensted C, Rosen BR. High resolution measurement of cerebral blood flow using intravascular tracer bolus passages. Part I: Mathematical approach and statistical analysis. Magn Reson Med. 1996;36:715–725. - PubMed
    1. Rosen BR, Belliveau JW, Vevea JM, Brady TJ. Perfusion imaging with NMR contrast agents. Magn Reson Med. 1990;14:249–265. - PubMed

Publication types

MeSH terms

Substances