Review
. 2009 Jun;394(3):731-42.
doi: 10.1007/s00216-009-2779-8. Epub 2009 Apr 18.

Current applications and future trends of molecular diagnostics in clinical bacteriology

Affiliations
Review

Current applications and future trends of molecular diagnostics in clinical bacteriology

Jan Weile et al. Anal Bioanal Chem. 2009 Jun.

Abstract

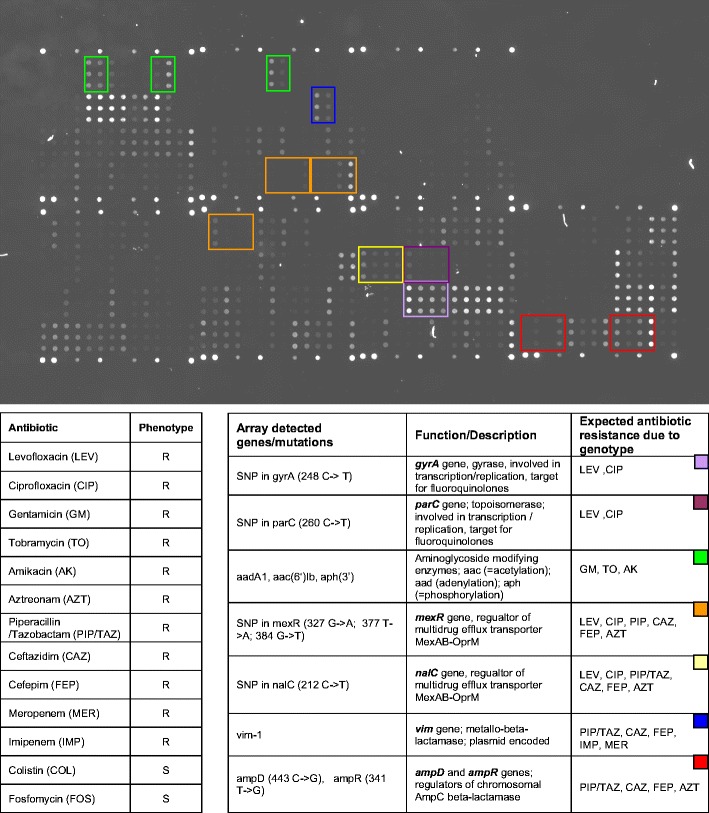
Molecular diagnostics of infectious diseases, in particular, nucleic-acid-based methods, are the fastest growing field in clinical laboratory diagnostics. These applications are stepwise replacing or complementing culture-based, biochemical, and immunological assays in microbiology laboratories. The first-generation nucleic acid assays were monoparametric such as conventional tests, determining only a single parameter. Improvements and new approaches in technology now open the possibility for the development of multiparameter assays using microarrays, multiplex nucleic acid amplification techniques, or mass spectrometry, while the introduction of closed-tube systems has resulted in rapid microbial diagnostics with a subsequently reduced contamination risk. Whereas the first assays were focused on the detection and identification of microbial pathogens, these new technologies paved the way for the parallel determination of multiple antibiotic resistance determinants or to perform microbial epidemiology and surveillance on a genetic level.


Figures

Fig. 1
Fig. 1
Different detection principles of fluorescent-labeled hybridization probes. a Fluorescence resonance energy transfer (FRET); head-to-tail arrangement of two probes. b TaqMan probes; 5′–3′ exonuclease activity of Taq polymerase leads to a fluorescence signal
Fig. 2
Fig. 2
Quantification of Pseudomonas aeruginosa by real-time LightCycler PCR using standard curve analysis. In the upper part of the diagram, fluorescence signals of a 1:10 dilution series of defined P. aeruginosa genome equivalents (1 × 108 to 1 × 102) are displayed (measurement in duplicates). Based on the correlation of crossing-point CP (PCR cycle which is significantly different to the background fluorescence noise) to P. aeruginosa DNA concentration, a standard curve was calculated (lower part of the diagram). The linear correlation of this standard curve (theoretical slope = −3.33; determined slope = −3.86) allows the quantification of an unknown sample based on the CP of the respective sample
Fig. 3
Fig. 3
Emulsion PCR DNA sequencing technology on Genome Sequencer 20 and FLX Systems (Roche Diagnostics). a Emulsion PCR: single-stranded DNA (ssDNA) library beads are added to the “DNA bead incubation mix” (containing DNA polymerase) and are layered with “enzyme beads” (containing sulfurylase and luciferase) onto the PicoTiterPlate device. The device is centrifuged to deposit the beads into the wells. The layer of Enzyme Beads ensures that the DNA beads remain positioned in the wells during the sequencing reaction. The bead-deposition process maximizes the number of wells that contain a single amplified library bead (avoiding more than one sstDNA library bead per well). b Pyrosequencing: the loaded PicoTiterPlate device is placed into the Genome Sequencer FLX Instrument. The fluidics sub-system flows sequencing reagents (containing buffers and nucleotides) across the wells of the plate. Nucleotides are flowed sequentially in a fixed order across the PicoTiterPlate device during a sequencing run. During the nucleotide flow, each of the hundreds of thousands of beads with millions of copies of DNA is sequenced in parallel. If a nucleotide complementary to the template strand is flowed into a well, the polymerase extends the existing DNA strand by adding nucleotide(s). Addition of one (or more) nucleotide(s) results in a reaction that generates a light signal that is recorded by the CCD camera in the Instrument. The signal strength is proportional to the number of nucleotides, for example, homopolymer stretches, incorporated in a single-nucleotide flow. Provided and reprinted by permission from Roche Diagnostics, Mannheim, Germany
Fig. 4
Fig. 4
General workflow for ClinProt BioTyper (Bruker Daltonics, Billerica, MA, USA) microorganism identification and classification using MALDI-TOF MS. Reprinted by permission from [76]
Fig. 5
Fig. 5
DNA microarray hybridization pattern of a multidrug-resistant P. aeruginosa clinical isolate. Compared to reference strain P. aeruginosa PAO1 (www.pseudomonas.com), which exhibits no resistance against therapy relevant anti-pseudomonal antibiotics, this P. aeruginosa strain harbors various genes or mutations assigned to antibiotic resistance. Single-nucleotide polymorphisms were detected in gyrA, parC, mexR, nalC, ampD, and ampR gene, respectively. Additionally, specific fluorescence signals above the cut-off indicated the presence of a vim-1, aac(6′)-Ib, aph(3′) and aadA1 gene (all positions are highlighted by colored frames). The observed phenotypical resistance was in complete accordance with the resistance determinants detected by DNA microarray genotyping. As indicated in the table, different resistance mechanisms rendering the same antibiotics as resistant (e.g. target alteration in gyrase and topoisomerase as well as efflux for fluoroquinolones, or chromosomal and plasmid encoded beta-lactamases as well as efflux for penicillins, cephalosporines, and carbapenems) were present at the same time, demonstrating the complex underlying genotype of phenotypically expressed resistance
Fig. 6
Fig. 6
Bead-based Luminex xMAP system. a A set of 100 microspheres, each microsphere having a unique ratio of two fluorescent dyes. b The microspheres are identified individually in a rapidly flowing fluid stream that passes by two laser beams: one reveals the color code of the bead, and one quantifies the biomolecular reaction by measuring the fluorescence intensity of the reporter. Reprinted from [114]

Similar articles

Cited by

References

    1. Mohr O’Hara C, Weinstein MP, Miller JM. In: Manual of clinical microbiology. 8. Murray PR, editor. Washington, DC: ASM; 2003. pp. 185–207.
    1. Andreotti PE, Ludwig GV, Peruski AH, Tuite JJ, Morse SS, Peruski LF. Biotechniques. 2003;35:850–859. doi: 10.2144/03354ss02. - DOI - PubMed
    1. Fahr AM, Hammann R. J Clin Microbiol. 1998;36:1464. - PubMed
    1. Ludwig W. Int J Food Microbiol. 2007;120:225–236. doi: 10.1016/j.ijfoodmicro.2007.06.023. - DOI - PubMed
    1. Konstantinidis KT, Ramette A, Tiedje JM. Philos Trans R Soc Lond B Biol Sci. 2006;361:1929–1940. doi: 10.1098/rstb.2006.1920. - DOI - PMC - PubMed

Publication types

MeSH terms