. 2009:539:115-29.
doi: 10.1007/978-1-60327-003-8_7.

Imaging specific cell surface protease activity in living cells using reengineered bacterial cytotoxins

Affiliations

Imaging specific cell surface protease activity in living cells using reengineered bacterial cytotoxins

John P Hobson et al. Methods Mol Biol. 2009.

Abstract

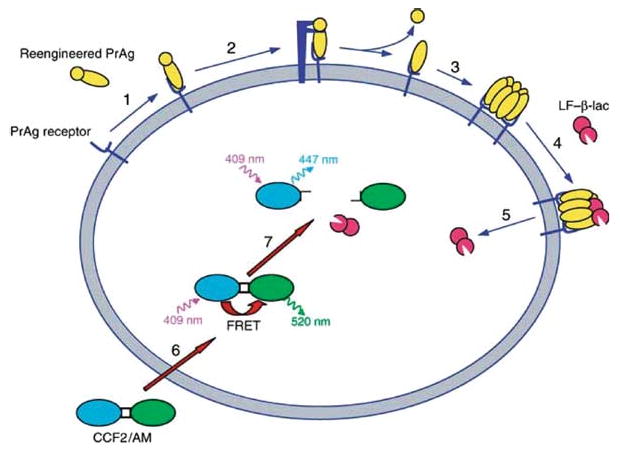
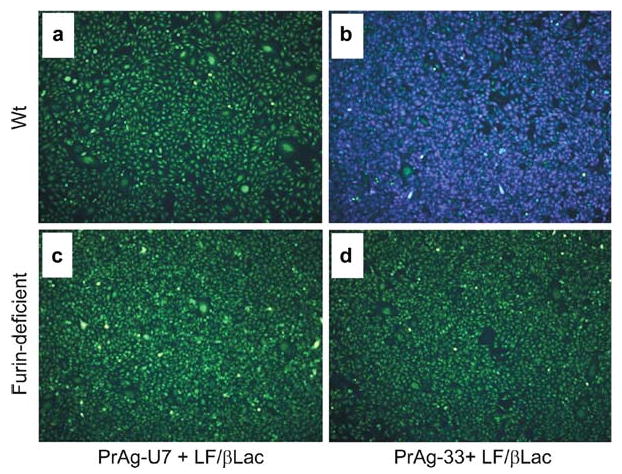
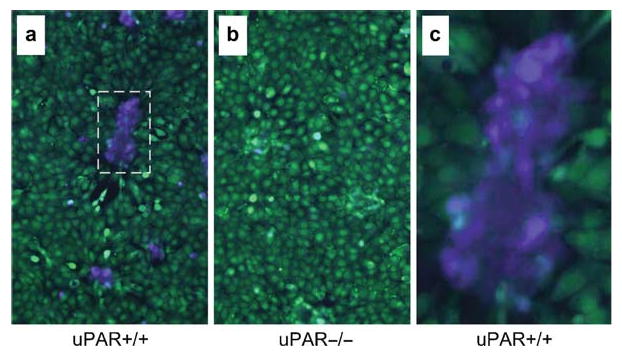
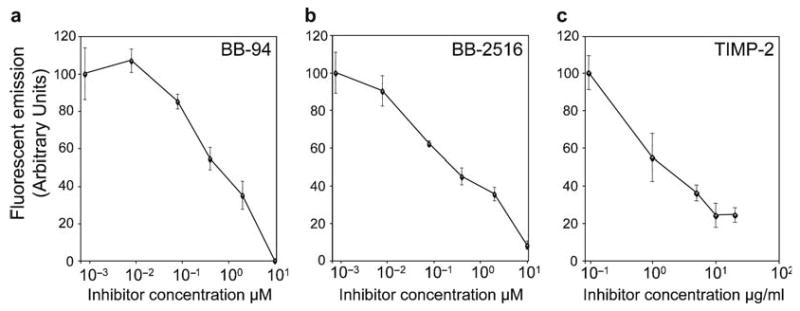
The scarcity of methods to visualize the activity of individual cell surface proteases in situ has hampered basic research and drug development efforts. In this chapter, we describe a simple, sensitive, and noninvasive assay that uses nontoxic reengineered bacterial cytotoxins with altered protease cleavage specificity to visualize specific cell surface proteolytic activity in single living cells. The assay takes advantage of the absolute requirement for site-specific endoproteolytic cleavage of cell surface-bound anthrax toxin protective antigen for its capacity to translocate an anthrax toxin lethal factor-beta-lactamase fusion protein to the cytoplasm. A fluorogenic beta-lactamase substrate is then used to visualize the cytoplasmically translocated anthrax toxin lethal factor-beta-lactamase fusion protein. By using anthrax toxin protective antigen variants that are reengineered to be cleaved by furin, urokinase plasminogen activator, or metalloproteinases, the cell surface activities of each of these proteases can be specifically and quantitatively determined with single cell resolution. The imaging assay is excellently suited for fluorescence microscope, fluorescence plate reader, and flow cytometry formats, and it can be used for a variety of purposes.


Figures

Fig. 1
Fig. 1
Principle of cell surface protease activity imaging assay. (1) PrAg mutants with reengineered protease cleavage specificity bind to ubiquitous high affinity cell surface receptors. (2) The PrAg mutants are cleaved by the cell surface proteolytic activity to be imaged. (3) The PrAg fragment that remains on the cell surface heptamerizes. (4) High-affinity binding sites for LF/β-Lac are generated by heptamerization of the PrAg. (5) LF/β-Lac is translocated to the cytoplasm after endocytosis of the PrAg-LF/β-Lac complex (not shown). (6) CCF2/AM is added to cells and diffuses into the cytoplasm where it is trapped by hydrolysis of its hydroxethyl ester groups by nonspecific cytoplasmic esterases. (7) LF/β-Lac hydrolyses the cephalosporin ring of CCF2/AM, causing a shift in fluorescence emission from 520 nm (green light) to 447 nm (blue light) after excitation of cells at 409 nm. Blue fluorescence emission by a cell demonstrates specific cell surface proteolytic activity. Reproduced from ref.12.
Fig. 2
Fig. 2
Specific imaging of endogenous cell surface furin proteolytic activity in single living cells. Wild-type (a and b) or furin-deficient (c and d) Chinese hamster ovary cells were incubated with 90 nM LF/β-Lac and 26 nM (2 μg/mL) PrAg-U7 (a and c), or 90 nM LF/β-Lac and 26 nM PrAg-33 (b and d) for 60 min. Thereafter, 1.5 μM CCF2/AM was added to the cells for 60 min at room temperature. The CCF2/AM remaining in the medium was removed by washing, and the cells were incubated for 60 min at room temperature to allow for CCF2/AM hydrolysis. The cells then were subjected to fluorescence microscopy using an excitation wavelength of 405 nm and emission filters of 530 nm (green light) and 460 nm (blue light). Specific imaging of furin proteolytic activity is demonstrated by the bright blue fluorescence of wild-type cells (b), but not furin-deficient cells (d), treated with LF/β-Lac and PrAg-33, or wild-type and furin-deficient cells treated with LF/β-Lac and PrAg-U7 (a and c). Reproduced in part from ref.12.
Fig. 3
Fig. 3
Specific imaging of endogenous cell surface uPA activity in mixed tumor cell stromal cell cultures. Mixed cultures of HN-26 oral squamous carcinoma cells and wild type (uPAR+/+, a and c) or urokinase plasminogen activator receptor (uPAR) knockout (uPAR-/-, b) fibroblasts were treated with 90 nM LF/β-Lac (5 μg/mL), 26 nM (2 μg/mL) PrAg-U2, and 11 nM (1 μg/mL) plasminogen for 60 min. Thereafter, 1.5 μM CCF2/AM was added to the cells for 60 min at room temperature. The CCF2/AM remaining in the medium was removed by washing, and the cells were incubated for 60 min at room temperature to allow for CCF2/AM hydrolysis. The cells then were subjected to fluorescence microscopy using an excitation wavelength of 405 nm and emission filters of 530 (green light) and 460 nm (blue light). Cell surface uPA activity is exclusively observed in nontransformed fibroblasts (a and c) and is dependent on the expression of uPAR, as shown by the strong blue fluorescence of islands of uPAR+/+ (a), but not in uPAR−/− (b) fibroblasts, and by green fluorescence of the tumor cells. (c) is a high magnification of the boxed area in (a) illustrating the confinement of uPA activity to fibroblasts. Reproduced in part from ref.12.
Fig. 4
Fig. 4
Quantitative analysis of the inhibition of cell surface metalloproteinase activity in human tumor cells. HT-1080 fibrosarcoma cells were seeded in a 96-well microtiter plate and treated for 60 min with 90 nM (5 μg/mL) LF/β-Lac and 26 nM (2 μg/mL) PrAg-L1 in the presence of increasing concentrations of the metalloprotease inhibitors BB-94 (a), BB-2516 (b), and TIMP-2 (c). Thereafter, 1.5 μM CCF2/AM was added to the cells for 60 min at room temperature. The CCF2/AM remaining in the medium was removed by washing, and the cells were incubated for 60 min at room temperature to allow for CCF2/AM hydrolysis. Fluorescence emission was recorded with a plate reader using 405 nm excitation and 460/25 nm bandpass for blue fluorescence and 535/25 nm bandpass for green fluorescence. The data are expressed as mean ± standard error of the mean of triplicate determinations. Reproduced in part from ref.12.

Similar articles

Cited by

References

    1. Werb Z. ECM and cell surface pro-teolysis: regulating cellular ecology. Cell. 1997;91(4):439–42. - PubMed
    1. Andreasen PA, Egelund R, Petersen HH. The plasminogen activation system in tumor growth, invasion, and metastasis. Cell Mol Life Sci. 2000;57(1):25–40. - PMC - PubMed
    1. McCawley LJ, Matrisian LM. Matrix metalloproteinases: multifunctional contributors to tumor progression. Mol Med Today. 2000;6(4):149–56. - PubMed
    1. Turk B, Turk D, Turk V. Lysosomal cysteine proteases: more than scavengers. Biochim Biophys Acta. 2000;1477(12):98–111. - PubMed
    1. Koblinski JE, Ahram M, Sloane BF. Unraveling the role of proteases in cancer. Clin Chim Acta. 2000;291(2):113–35. - PubMed

Publication types

MeSH terms

LinkOut - more resources