

Methodology for using long-term accelerometry monitoring to describe daily activity patterns in COPD
- PMID: 19378225
- PMCID: PMC2862250
- DOI: 10.1080/15412550902755044
Methodology for using long-term accelerometry monitoring to describe daily activity patterns in COPD
Abstract
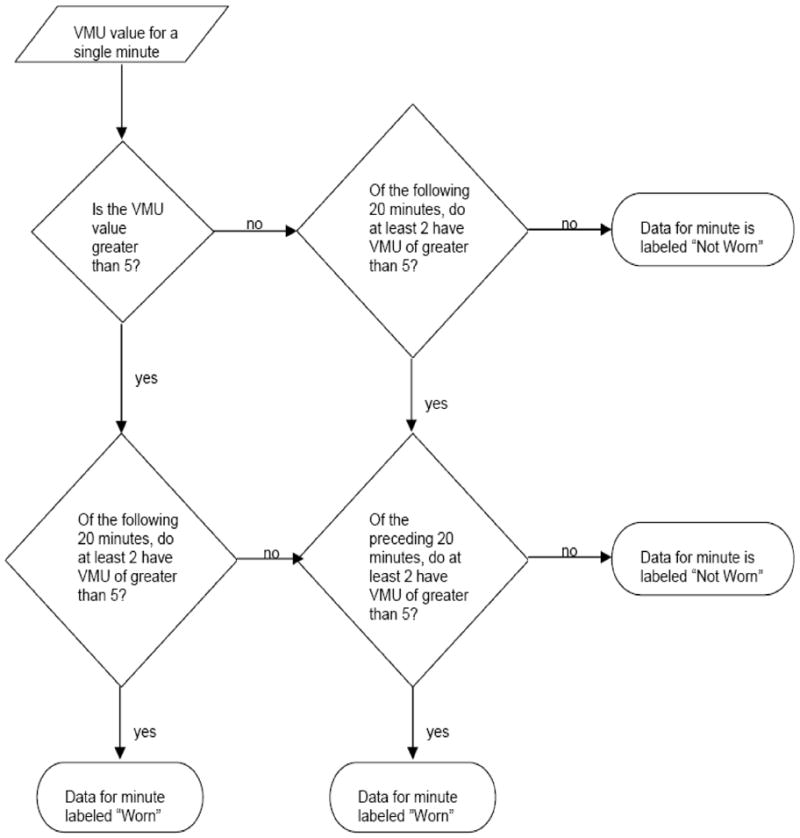
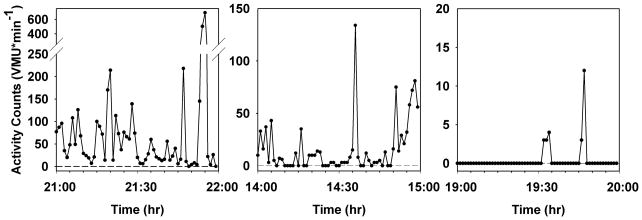
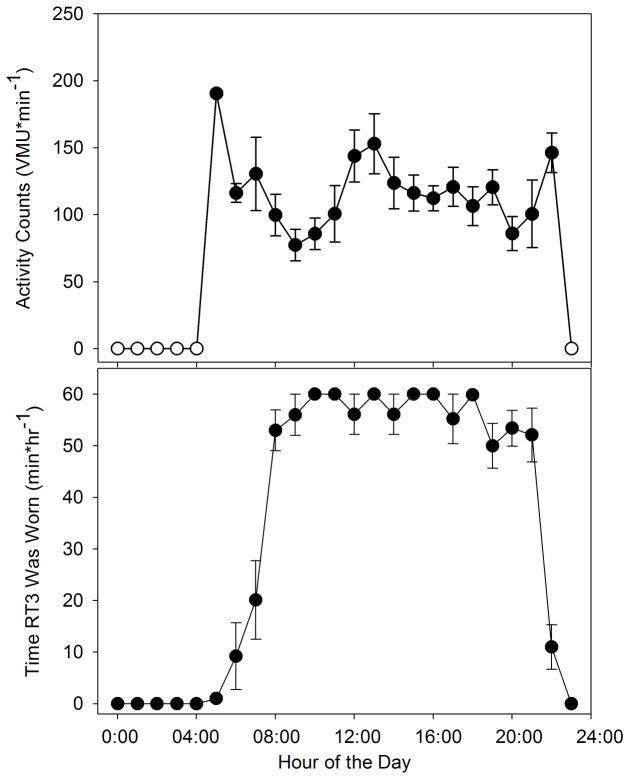
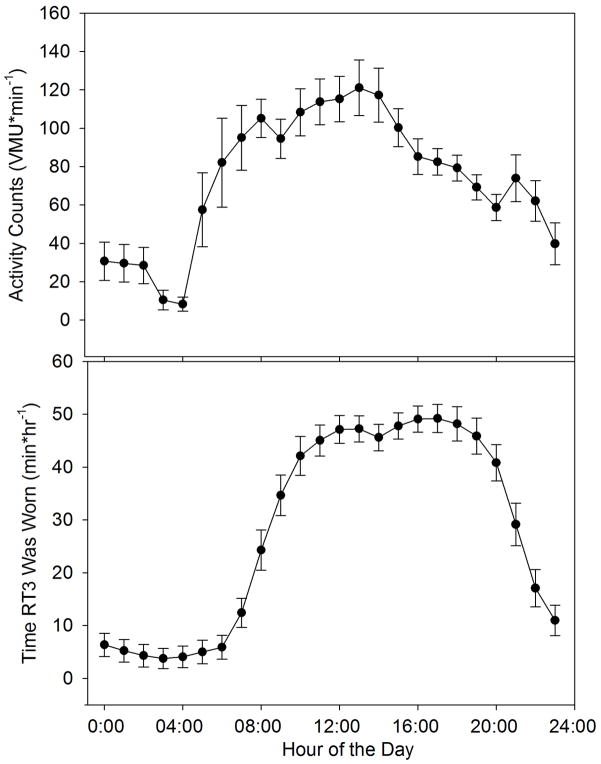
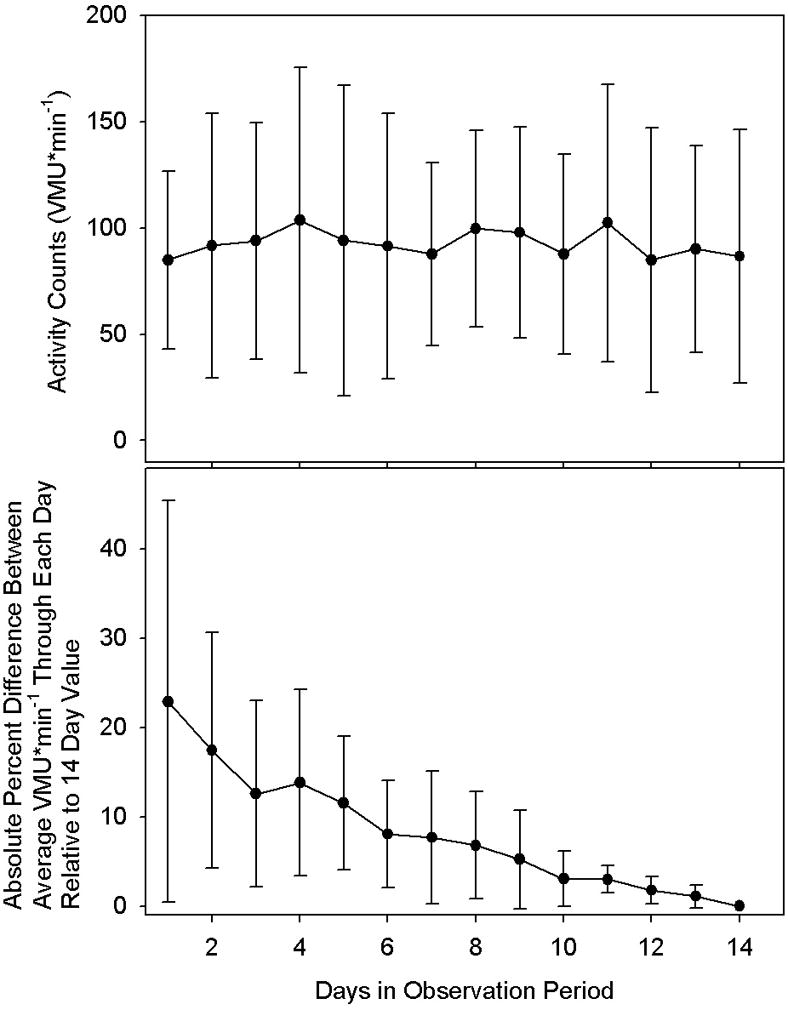
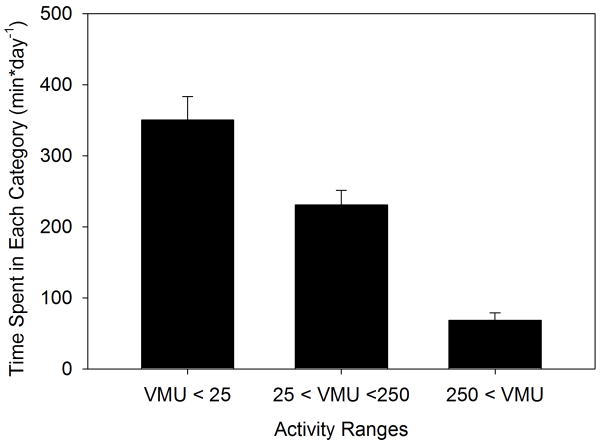
We sought to develop procedures for computerized analysis of long-term, high-resolution activity monitoring data that allow accurate assessment of the time course of activity levels suitable for use in chronic obstructive pulmonary disease (COPD) patients. Twenty-two COPD patients utilizing long-term oxygen recruited from 5 sites of the COPD Clinical Research Network wore a triaxial accelerometer (RT3, Stayhealthy, Monrovia, CA) during waking hours over a 14-day period. Computerized algorithms were composed allowing minute-by-minute activity data to be analyzed to determine, for each minute, whether the monitor was being worn. Temporal alignment allowed determination of average time course of activity level, expressed as average vector magnitude units (VMU, the vectorial sum of activity counts in three orthogonal directions) per minute, for each hour of the day. Mid-day activity was quantified as average VMU/minute between 10AM and 4PM for minutes the monitor was worn. Over the 14 day monitoring period, subjects wore the monitor an average of 11.4 +/- 3.0 hours x day(-1). During mid-day hours, subjects wore the monitor 76.3% of the time and generated an average activity level of 112 +/- 55 VMU x min(-1). Increase in precision of activity estimates with longer monitoring periods was demonstrated. This analysis scheme allows a detailed temporal pattern of activity to be defined from triaxial accelerometer recordings and has the potential to facilitate comparisons among subjects and between subject groups. This trial is registered at ClinicalTrials.gov (NCT00325754).
Conflict of interest statement
The authors have no conflicts of interest to report.
Figures
Comment in
-
Physical activity monitoring: a new outcome facing many challenges, but yielding promising results.COPD. 2009 Apr;6(2):82-3. doi: 10.1080/15412550902806037. COPD. 2009. PMID: 19378219 No abstract available.
References
-
- American College of Sports Medicine Position Stand. The recommended quantity and quality of exercise for developing and maintaining cardiorespiratory and muscular fitness, and flexibility in healthy adults. Med Sci Sports Exerc. 1998;30:975–91. - PubMed
-
- Belza B, Steele BG, Hunziker J, Lakshminaryan S, Holt L, Buchner DM. Correlates of physical activity in chronic obstructive pulmonary disease. Nurs Res. 2001;50:195–202. - PubMed
-
- Bendat J, Piersol A. Random Data: Analysis and Measurement Procedures. New York: John Wiley & Sons, Inc; 2000. Nonparametric Trend Test; pp. 105–8.
-
- Bowen JB, Votto JJ, Thrall RS, Haggerty MC, Stockdale-Woolley R, Bandyopadhyay T, ZuWallack RL. Functional status and survival following pulmonary rehabilitation. Chest. 2000;118:697–703. - PubMed
-
- Brage S, Brage N, Franks PW, Ekelund U, Wong MY, Andersen LB, Froberg K, Wareham NJ. Branched equation modeling of simultaneous accelerometry and heart rate monitoring improves estimate of directly measured physical activity energy expenditure. J Appl Physiol. 2004;96:343–51. - PubMed
Publication types
MeSH terms
Associated data
Grants and funding
- U10 HL074416/HL/NHLBI NIH HHS/United States
- 1U10-HL074431/HL/NHLBI NIH HHS/United States
- M01 RR000056/RR/NCRR NIH HHS/United States
- M01 RR16500/RR/NCRR NIH HHS/United States
- U10 HL074428/HL/NHLBI NIH HHS/United States
- HL074407/HL/NHLBI NIH HHS/United States
- HL074418/HL/NHLBI NIH HHS/United States
- U10 HL074441/HL/NHLBI NIH HHS/United States
- U10 HL074409/HL/NHLBI NIH HHS/United States
- U10 HL074431/HL/NHLBI NIH HHS/United States
- HL074439/HL/NHLBI NIH HHS/United States
- U10 HL074424/HL/NHLBI NIH HHS/United States
- M01 RR00425/RR/NCRR NIH HHS/United States
- M01 RR00056/RR/NCRR NIH HHS/United States
- 1U10-HL074416/HL/NHLBI NIH HHS/United States
- M01 RR00051/RR/NCRR NIH HHS/United States
- HL074428/HL/NHLBI NIH HHS/United States
- U10 HL074439/HL/NHLBI NIH HHS/United States
- M01 RR002635/RR/NCRR NIH HHS/United States
- M01 RR02635/RR/NCRR NIH HHS/United States
- U10 HL074408/HL/NHLBI NIH HHS/United States
- 1U10-HL074424/HL/NHLBI NIH HHS/United States
- HL074422/HL/NHLBI NIH HHS/United States
- U10 HL074422/HL/NHLBI NIH HHS/United States
- HL074441/HL/NHLBI NIH HHS/United States
- M01 RR000051/RR/NCRR NIH HHS/United States
- U10 HL074407/HL/NHLBI NIH HHS/United States
- M01 RR016500/RR/NCRR NIH HHS/United States
- HL074408/HL/NHLBI NIH HHS/United States
- M01 RR000425/RR/NCRR NIH HHS/United States
- U10 HL074418/HL/NHLBI NIH HHS/United States
- HL074409/HL/NHLBI NIH HHS/United States
LinkOut - more resources
Full Text Sources
Medical
Miscellaneous