Review
doi: 10.1387/ijdb.072495ip.
Genomic control of patterning
Affiliations
- PMID: 19378258
- PMCID: PMC3967875
- DOI: 10.1387/ijdb.072495ip
Item in Clipboard
Review
Genomic control of patterning
Int J Dev Biol.
2009.
Abstract
The development of multicellular organisms involves the partitioning of the organism into territories of cells of specific structure and function. The information for spatial patterning processes is directly encoded in the genome. The genome determines its own usage depending on stage and position, by means of interactions that constitute gene regulatory networks (GRNs). The GRN driving endomesoderm development in sea urchin embryos illustrates different regulatory strategies by which developmental programs are initiated, orchestrated, stabilized or excluded to define the pattern of specified territories in the developing embryo.
Figures
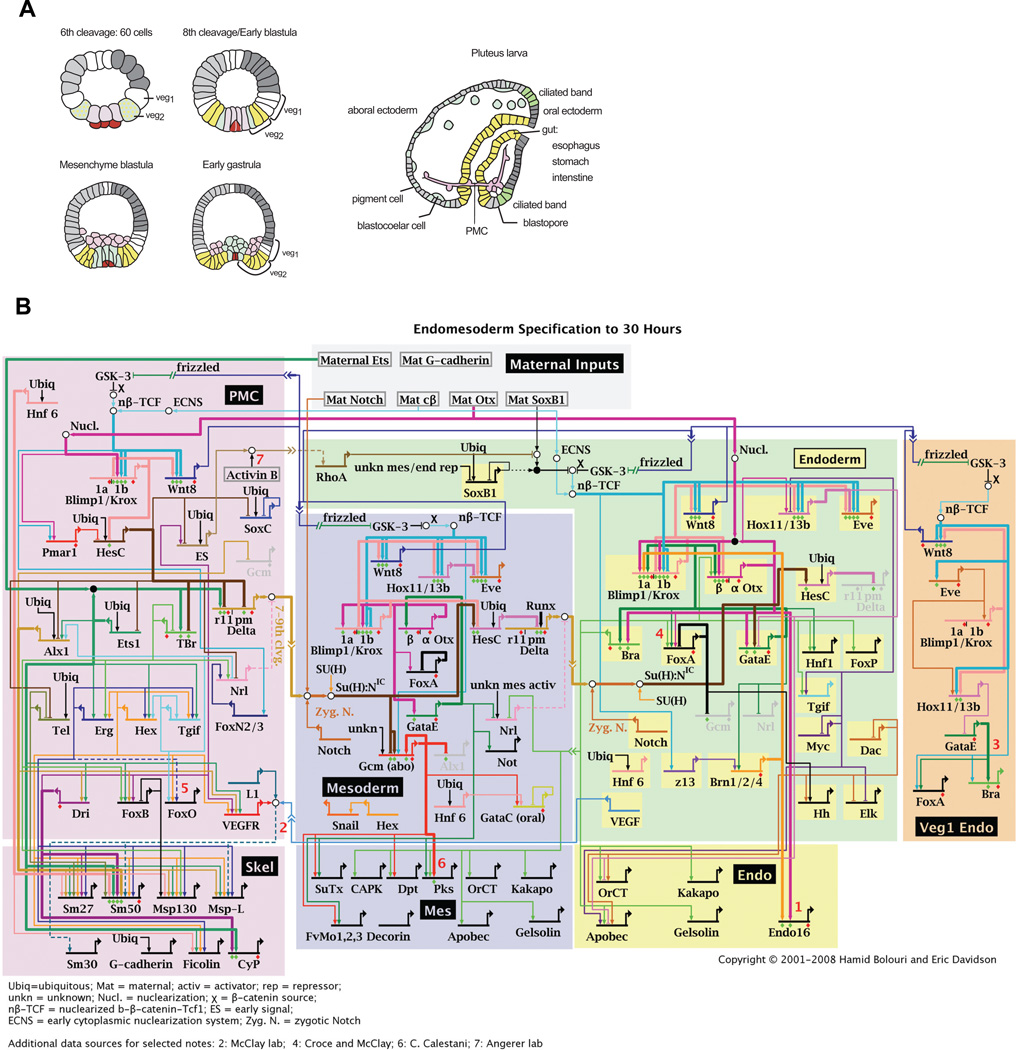
(A) Schematic sections of embryos at different stages of development. At 6th cleavage stage, endomesoderm precursor cells include the macromere-derived veg2 (green) and veg1 cells, large micromere derivatives (light purple) and the small micromere lineage (dark purple). Mesomeres are depicted in grey and are the precursors of ectoderm. Both, veg2 and veg1 cells will give rise to two different territories, depending on their location relative to the vegetal pole. Proximal veg2 cells are the progenitors of NSMs (blue), whereas the remaining veg2-derived cells contribute to endoderm (yellow), as shown in the scheme for 8th cleavage stage embryos. Veg1-derived cells give rise to endoderm and ectoderm. By the mesenchyme blastula stage, the SMs have ingressed into the blastocoel. NSM precursors start to ingress at beginning of gastrulation and give rise to pigment cells and blastocoelar cells. At pluteus larva stage, SMs have fused and formed the embryonic skeleton. (B) Model for the GRN driving endomesoderm development. Color codes match the embryonic territories depicted in (A). Network nodes represent regulatory genes and connections represent regulatory interactions. Regulatory genes are grouped based on the process they are involved in: SM, NSM or endoderm specification. Updates of the endomesoderm GRN are available at: http://sugp.caltech.edu/e ndomes (Davidson et al., 2002).
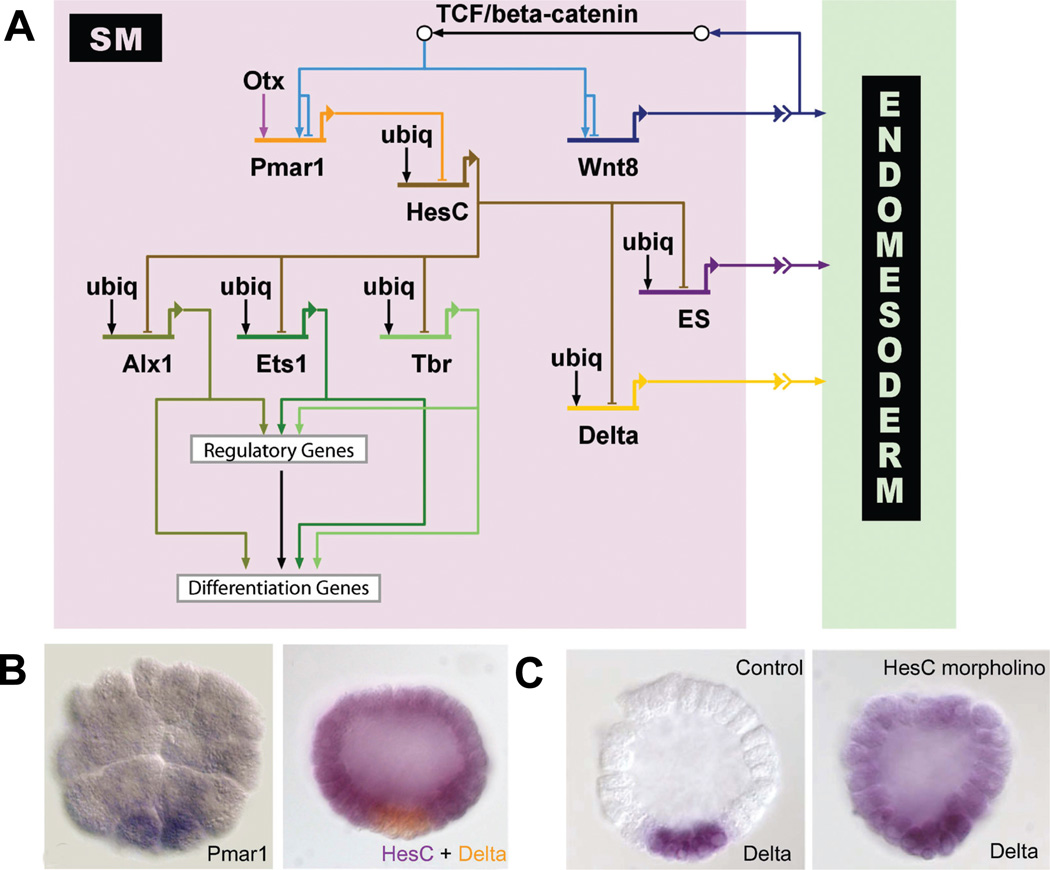
(A) Model of the GRN driving SM development. The double repression by Pmar1 and HesC gives rise to a micromere- specific expression of alx1, ets1 and t-brain (tbr). All three transcription factors further activate other regulatory genes as well as the differentiation gene battery. The SM GRN drives the expression of three genes encoding signaling molecules which are required for endomesoderm specification: wnt8, the early signal and delta. (B) Left: Whole-mount in situ hybridization (WMISH) of 5th cleavage stage embryos detecting pmar1 gene expression in micromeres. (Reprinted from Oliveri et al., 2002; with permission from Elsevier). Right: Two color WMISH monitoring hesC (violet) and delta (orange) gene expression in 7th cleavage stage embryos. (Reprinted from Revilla-i-Domingo et al., 2007; with permission from the National Academy of Sciences, USA). Whereas delta is expressed exclusively in the micromeres, hesC expression is ubiquitous except for repression in micromere derivatives by Pmar1. (C) Expression of delta was detected by WMISH in micromere-derived cells of control embryos (left) and ubiquitously in embryos in which HesC expression has been blocked by morpholinos (right). The results show that delta expression is activated by ubiquitous transcription factors and repressed by HesC in all cells except the micromere derivatives, where HesC is not present. (Reprinted from Revilla-i-Domingo et al., 2007; with permission from the National Academy of Sciences, USA).
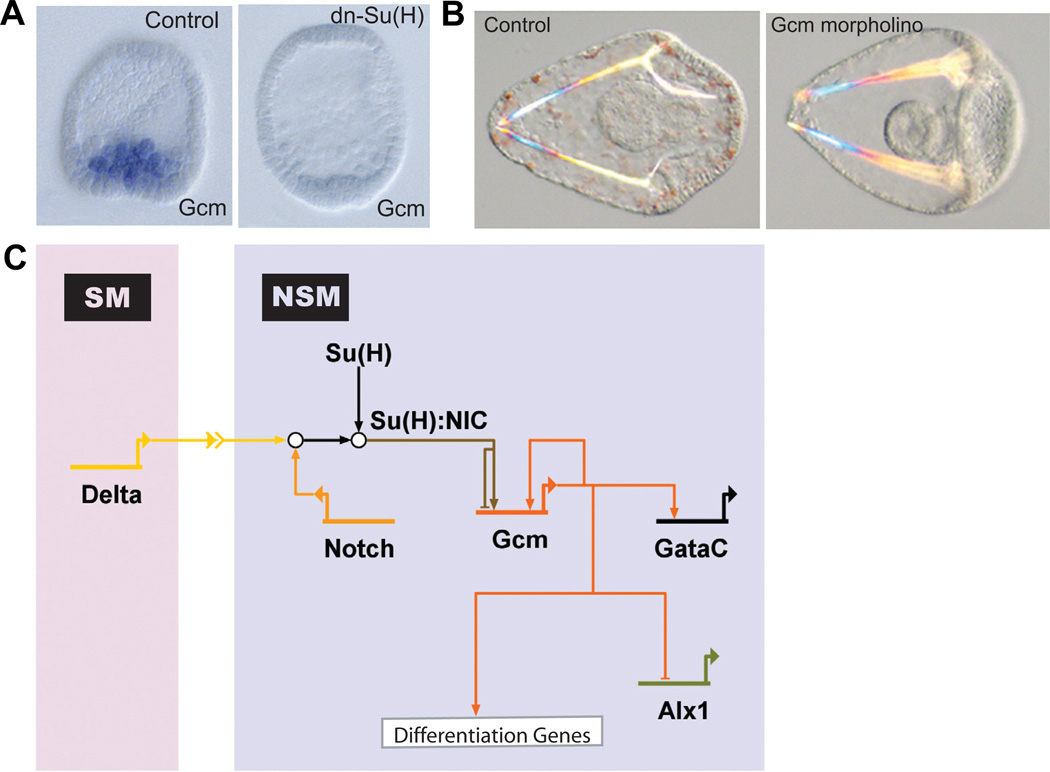
(A) WMISH for gcm on control embryos (left) and embryos injected with mRNA encoding a dominant-negative (dn) form of the transcription factor Su(H) (dn-Su(H)) (right). Su(H) mediates a toggle-switch mechanism by interacting either with the repressor protein Groucho or, in the presence of Delta/Notch signaling, with the intracellular part of Notch (NIC). Gcm is expressed in NSM precursors at blastula stage in control embryos, but does not express significantly in embryos injected with dn-Su(H), indicating that gcm is a target gene of Su(H). (Reprinted from Ransick et al., 2006; with permission from Elsevier). (B) Control pluteus larva (left) and pluteus larva that developed after injection of gcm-specific morpholinos (right). Note the lack of pigment cells as a result of interfering with gcm expression, showing that Gcm is required for pigment cell formation. (Reprinted from Ransick et al., 2006; with permission from Elsevier). (C) Model for the GRN underlying NSM specification. Delta expression in micromere-derived cells induces the cleavage of Notch receptor in adjacent NSM precursor cells. NIC interacts with Su(H) leading to activation of gcm expression. Gcm expression is maintained by an autoregulatory feedback loop. Gcm also provides activating inputs into gataC and the differentiation genes. To exclude alternative cell fates, Gcm represses alx1.
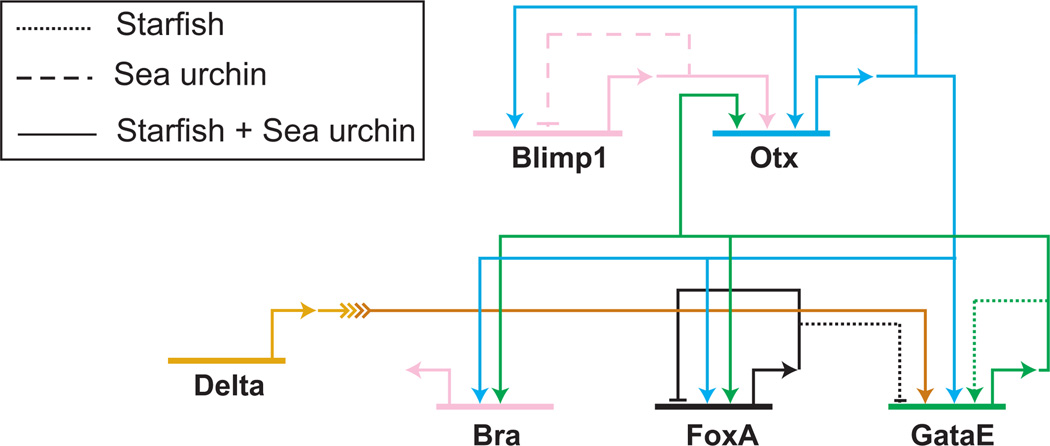
The regulatory linkages between blimp1, otx, bra, foxA and gataE have been analyzed in sea urchin and starfish embryos. Most of the regulatory interactions between these genes are identical and are shown by solid lines. Otx expression is first induced by Blimp1 and is later on maintained by two positive feedback loops: Otx and one of its target genes, GataE, provide an input into otx. Otx together with GataE control the expression of bra and foxA. Interactions that are unique in one of the species are shown as dashed (sea urchin) or dotted (starfish) lines. Not conserved regulatory linkages include the auto-repression of blimp1 in sea urchin and the autoregulation of gataE in starfish. (Modified from Hinmann et al., 2003).
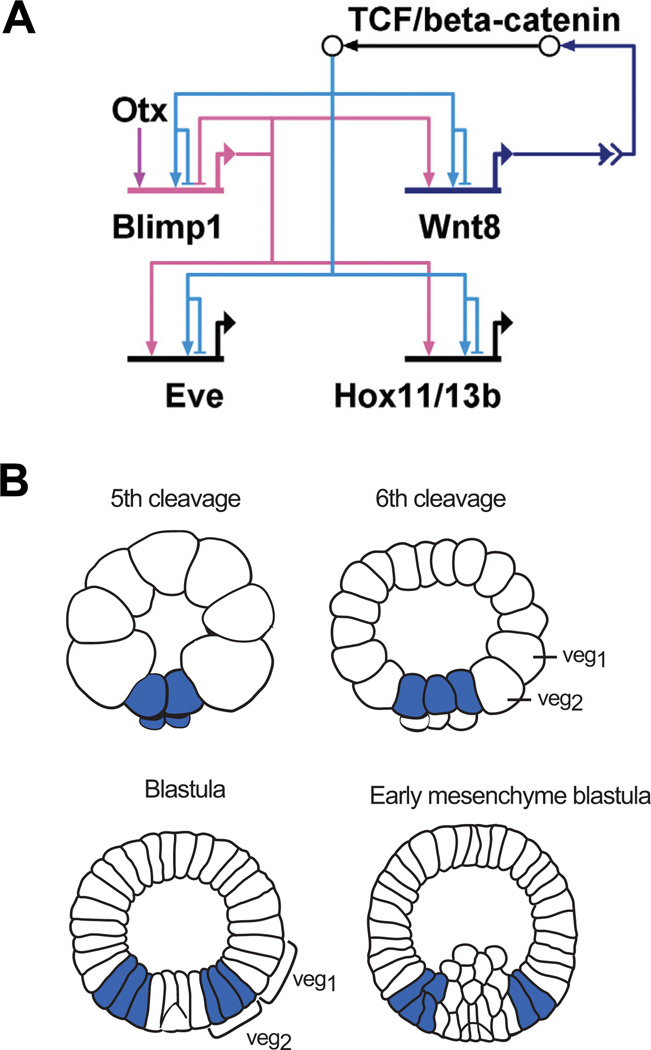
(A) Model of a subcircuit which results in a dynamic gene expression pattern. Two positive feedback loops induce the activation of this subcircuit in adjacent cells: β- catenin/TCF activates the expression of wnt8 and blimp1. Blimp1 provides an additional input into wnt8. Reception of the Wnt signal leads to nuclearization of β-catenin and activation of this subcircuit in neighboring cells. Blimp1 and β-catenin/TCF are both required to induce the expression of eve and hox11/13b. The expression of blimp1 is turned off by its own gene product, leading to inactivation of the whole subcircuit. (B) Schematic presentation of wnt8 expression pattern. Wnt8 is expressed in the micromere lineage at 5th cleavage, from where it expands to veg2-and veg1-derived cells. Wnt8 is no longer expressed in the SM precursors at blastula stage and in NSM precursors at early mesenchyme blastula. (Modified from Smith et al., 2007).
Comment in
-
Pattern formation today.Int J Dev Biol. 2009;53(5-6):653-8. doi: 10.1387/ijdb.082594cc. Int J Dev Biol. 2009. PMID: 19557673 Free PMC article. Review.
References
-
- Arenas-Mena C, Cameron RA, Davidson EH. Hindgut specification and cell-adhesion functions of sphox11/13b in the endoderm of the sea urchin embryo. Dev. Growth Differ. 2006;48:463–472. - PubMed
-
- Ben-Tabou De-Leon S, Davidson EH. Gene regulation: Gene control network in development. Annu. Rev. Biophys. Biomol. Struct. 2007;36:191–212. - PubMed
-
- Davidson EH. Genomic regulatory systems: Development and evolution. San Diego: Acdemic Press; 2001.
-
- Davidson EH. The regulatory genome. Gene regulatory networks in development and evolution. San Diego, CA.: Academic Press/Elsevier; 2006.
-
- Davidson EH, Rast JP, Oliveri P, Ransick A, Calestani C, Yuh CH, Minokawa T, Amore G, Hinman V, Arenas-Mena C, et al. A genomic regulatory network for development. Science. 2002;295:1669–1678. - PubMed
Publication types
MeSH terms
Grants and funding
LinkOut - more resources
Full Text Sources
Miscellaneous