Review
. 2009 Apr;5(4):353-66.
doi: 10.1517/17425250902877698.

N-acetyltransferase SNPs: emerging concepts serve as a paradigm for understanding complexities of personalized medicine

Affiliations
Review

N-acetyltransferase SNPs: emerging concepts serve as a paradigm for understanding complexities of personalized medicine

David W Hein. Expert Opin Drug Metab Toxicol. 2009 Apr.

Abstract

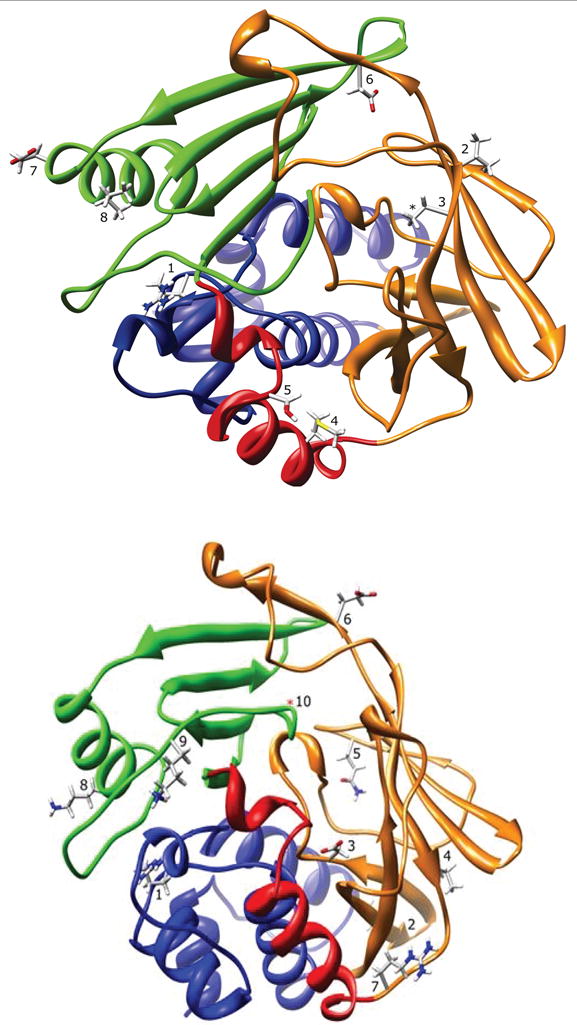
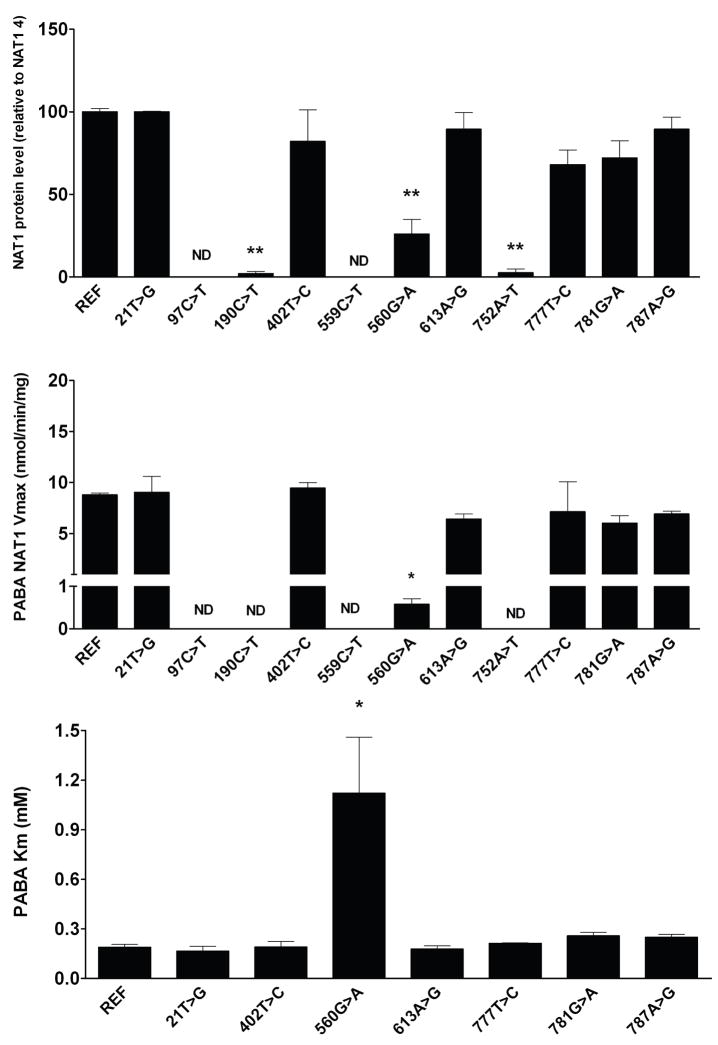
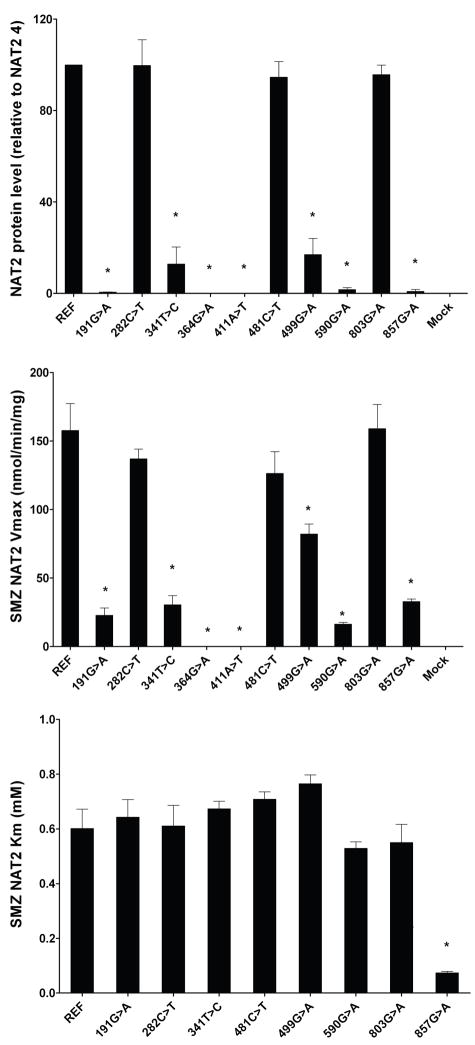
Arylamine N-acetyltransferase 1 and 2 exhibit single nucleotide polymorphisms in human populations that modify drug and carcinogen metabolism. This paper updates the identity, location and functional effects of these single nucleotide polymorphisms and then follows with emerging concepts for understanding why pharmacogenetic findings may not be replicated consistently. Using this paradigm as an example, laboratory-based mechanistic analyses can reveal complexities such that genetic polymorphisms become biologically and medically relevant when confounding factors are more fully understood and considered. As medical care moves to a more personalized approach, the implications of these confounding factors will be important in understanding the complexities of personalized medicine.


Figures

Figure 1
Figure 1
NAT1 (top) and NAT2 (bottom) ribbon diagrams. The ribbon is colored to indicate N-acetyltransferase protein domain I (blue), the interdomain region (red), domain II (orange), and domain III (green). Top: R64 (1), V149 (2), R187 (3), M205 (4), S214 (5), D251 (6), E261 (7), and I263 (8) are shown for NAT1. The 2PQT PDB file is missing coordinates for the arginine side-chain guanidine group at residue R187 (*). Bottom: R64 (1), I114 (2), D122 (3), L137 (4), Q145 (5), E167 (6), R197 (7), K268 (8), K282 (9), and G286 (10) are shown for NAT2. Adapted from [27,28].
Figure 2
Figure 2
Top: Effects of SNPs in the NAT1 coding region on recombinant NAT1 protein level. NAT1 protein and endogenous control α-tubulin levels were visualized by western blots, quantitated by densitometry, and presented in arbitrary units. REF refers to NAT1 4 (no SNPs). Each bar represents Mean ± S.E.M from three transfections in duplicate. NAT1-specific protein level for the variant allozymes was compared to NAT1 4 by one way ANOVA followed by Dunnett’s post-test. The NAT1 antibody did not detect the truncated NAT1 proteins from 97C>T(R33stop) and 559C>T(R187stop). **190C>T and 752A>T significantly (p<0.01) reduced NAT1 protein level over 40-fold and 560G>A significantly (p<0.01) reduced NAT1 protein level 4-fold. Middle: Effects of SNPs in the NAT1 coding region on p-aminobenzoic acid (PABA) N-acetyltransferase maximum velocities with PABA concentrations of 25 to 1000 μM in the presence of 1 mM AcCoA. PABA N-acetyltransferase activities were normalized to β-galactosidase activity. Each bar represents Mean ± S.E.M from three transfections in duplicate. Characters under bars indicate SNP(s) in corresponding haplotypes: REF, no SNP (reference NAT1*4) Activity for each variant allozymes was compared to reference NAT1 4 catalytic activity by one way ANOVA followed by Dunnett’s post-test. *significantly lower than NAT1 4 (p<0.01). PABA N-acetyltransferase catalytic activities for 97C>T, 190C>T, 559C>T and 752A>T were too low (<0.05 nmol/min/mg) to determine Vmax. Bottom: Effects of SNPs in the NAT1 coding region on PABA Km. The upper panel illustrates PABA Km determined with PABA concentrations of 25 to 1000 μM in the presence of 1 mM AcCoA. Each bar represents Mean ± S.E.M from three transfections in duplicate. REF, no SNP (reference NAT1*4). Km for each variant allozyme was compared to NAT1 4 by one way ANOVA followed by Dunnett’s post-test. *significantly greater than NAT1 4 (p<0.01). PABA N-acetyltransferase catalytic activities for 97C>T, 190C>T, 559C>T and 752A>T were too low (<0.05 nmol/min/mg) to determine Km. Adapted from [29].
Figure 3
Figure 3
Top: Effects of SNPs in the NAT2 coding region on recombinant NAT2 protein level. NAT2 protein and endogenous control α-tubulin levels were visualized by western blots, quantitated by densitometry, and presented in arbitrary units. REF refers to NAT2 4 (no SNPs). Mock: COS-1 cells transfected with the mock pcDNA5/FRT plasmid. Each bar represents Mean± S.E.M from three transfections in duplicate. NAT2-specific protein level for the variant allozymes was compared to NAT2 4 by one way ANOVA followed by Dunnett’s post-test.Mock: *significantly different (p<0.001). Middle: Effect of SNPs in the NAT2 coding region on sulfamethazine (SMZ) N-acetyltransferase maximum velocities with SMZ concentrations of 10 to 5000 μM in the presence of 1 mM AcCoA. SMZ N-acetyltransferase activities were normalized to β-galactosidase activity. Each bar represents Mean ± S.E.M from three transfections in duplicate. REF, no SNP (reference NAT2*4). Activity for each variant allozymes was compared to reference NAT2 4 catalytic activity by one way ANOVA followed by Dunnett’s post-test. *significantly lower than NAT2 4 (p<0.001). Bottom: Effect of SNPs in the NAT2 coding region on SMZ N-acetyltransferase Km with SMZ concentrations of 10 to 5000 μM in the presence of 1 mM AcCoA. SMZ N-acetyltransferase activities were normalized to β-galactosidase activity. Each bar represents Mean ± S.E.M from three transfections in duplicate. REF, no SNP (reference NAT2*4). Km for each variant allozymes was compared to reference NAT2 4 catalytic activity by one way ANOVA followed by Dunnett’s post-test. *significantly lower than NAT2 4 (p<0.001). Adapted from [41].

References

    1. Weber WW. The Acetylator Genes and Drug Response. Oxford University Press; New York: 1987. **Excellent overview, particularly with respect to history of the discovery.
    1. Weber WW, Hein DW. N-acetylation pharmacogenetics. Pharmacol Rev. 1985;37:25–79. **Excellent overview, particularly with respect to clinical and toxicological consequences. - PubMed
    1. Boukouvala S, Fakis G. Arylamine N-acetyltransferases: what we learn from genes and genomes. Drug Metab Rev. 2005;37:511–564. **Excellent overview, particularly with respect to genomic organization. - PubMed
    1. Westwood IM, Kawamura A, Fullam E, Russell AJ, Davies SG, Sim E. Structure and mechanism of arylamine N-acetyltransferases. Curr Top Med Chem. 2006;6:1641–1654. - PubMed
    1. Minchin RF, Hanna PE, Dupret JM, Wagner CR, Rodrigues-Lima F, Butcher NJ. Arylamine N-acetyltransferase I. Int J Biochem Cell Biol. 2007;39:1999–2005. - PubMed

Publication types

MeSH terms