Substance P stimulates bone marrow stromal cell osteogenic activity, osteoclast differentiation, and resorption activity in vitro
- PMID: 19379851
- PMCID: PMC2706279
- DOI: 10.1016/j.bone.2009.04.203
Substance P stimulates bone marrow stromal cell osteogenic activity, osteoclast differentiation, and resorption activity in vitro
Abstract
Introduction: SP is a neuropeptide distributed in the sensory nerve fibers that innervate the medullar tissues of bone, as well as the periosteum. Previously we demonstrated that inhibition of neuropeptide signaling after capsaicin treatment resulted in a loss of bone mass and we hypothesized that SP contributes to bone integrity by stimulating osteogenesis.
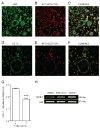
Materials and methods: Osteoblast precursors (bone marrow stromal cells, BMSCs) and osteoclast precursors (bone marrow macrophages, BMMs) derived from C57BL/6 mice were cultured. Expression of the SP receptor (NK1) was detected by using immunocytochemical staining and PCR. Effects of SP on proliferation and differentiation of BMSCs were studied by measuring BrdU incorporation, gene expression, alkaline phosphatase activity, and osteocalcin and Runx2 protein levels with EIA and western blot assays, respectively. Effects of SP on BMMs were determined using a BrdU assay, counting multinucleated cells staining positive for tartrate-resistant acid phosphatase (TRAP(+)), measuring pit erosion area, and evaluating RANKL protein production and NF-kappaB activity with ELISA and western blot.
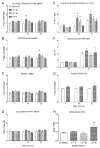
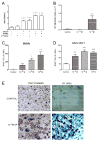
Results: The NK1 receptor was expressed in both BMSCs and BMMs. SP stimulated the proliferation of BMSCs in a concentration-dependent manner. Low concentrations (10(-12) M) of SP stimulated alkaline phosphatase and osteocalcin expression, increased alkaline phosphatase activity, and up-regulated Runx2 protein levels, and higher concentrations of SP (10(-8) M) enhanced mineralization in differentiated BMSCs. SP also stimulated BMSCs to produce RANKL, but at concentrations too low to evoke osteoclastogenesis in co-culture with macrophages in the presence of SP. SP also activated NF-kappaB in BMMs and directly facilitate RANKL-induced macrophage osteoclastogenesis and bone resorption activity.
Conclusions: NK1 receptors are expressed by osteoblast and osteoclast precursors and SP stimulates osteoblast and osteoclast differentiation and function in vitro. SP neurotransmitter release from sensory neurons could potentially regulate local bone turnover in vivo.
Figures


Similar articles
-
Calcitonin-gene-related peptide stimulates stromal cell osteogenic differentiation and inhibits RANKL induced NF-kappaB activation, osteoclastogenesis and bone resorption.Bone. 2010 May;46(5):1369-79. doi: 10.1016/j.bone.2009.11.029. Epub 2009 Dec 2. Bone. 2010. PMID: 19962460 Free PMC article.
-
DOK3 Modulates Bone Remodeling by Negatively Regulating Osteoclastogenesis and Positively Regulating Osteoblastogenesis.J Bone Miner Res. 2017 Nov;32(11):2207-2218. doi: 10.1002/jbmr.3205. Epub 2017 Aug 2. J Bone Miner Res. 2017. PMID: 28650106 Free PMC article.
-
Osteoblasts/stromal cells stimulate osteoclast activation through expression of osteoclast differentiation factor/RANKL but not macrophage colony-stimulating factor: receptor activator of NF-kappa B ligand.Bone. 1999 Nov;25(5):517-23. doi: 10.1016/s8756-3282(99)00210-0. Bone. 1999. PMID: 10574571
-
Osteoclasts have multiple roles in bone in addition to bone resorption.Crit Rev Eukaryot Gene Expr. 2009;19(3):171-80. doi: 10.1615/critreveukargeneexpr.v19.i3.10. Crit Rev Eukaryot Gene Expr. 2009. PMID: 19883363 Free PMC article. Review.
-
Novel functions for NFκB: inhibition of bone formation.Nat Rev Rheumatol. 2010 Oct;6(10):607-11. doi: 10.1038/nrrheum.2010.133. Epub 2010 Aug 10. Nat Rev Rheumatol. 2010. PMID: 20703218 Free PMC article. Review.
Cited by
-
Effects of Early Life Stress on Bone Homeostasis in Mice and Humans.Int J Mol Sci. 2020 Sep 10;21(18):6634. doi: 10.3390/ijms21186634. Int J Mol Sci. 2020. PMID: 32927845 Free PMC article.
-
The Role of Substance P in the Regulation of Bone and Cartilage Metabolic Activity.Front Endocrinol (Lausanne). 2020 Feb 28;11:77. doi: 10.3389/fendo.2020.00077. eCollection 2020. Front Endocrinol (Lausanne). 2020. PMID: 32180759 Free PMC article. Review.
-
Neuropeptides as regulators of bone metabolism: from molecular mechanisms to traditional Chinese medicine intervention strategies.Front Pharmacol. 2025 Feb 28;16:1516038. doi: 10.3389/fphar.2025.1516038. eCollection 2025. Front Pharmacol. 2025. PMID: 40093328 Free PMC article. Review.
-
Effects of Thermal Environment on Bone Microenvironment: A Narrative Review.Int J Mol Sci. 2025 Apr 9;26(8):3501. doi: 10.3390/ijms26083501. Int J Mol Sci. 2025. PMID: 40332035 Free PMC article. Review.
-
Substance P signaling mediates BMP-dependent heterotopic ossification.J Cell Biochem. 2011 Oct;112(10):2759-72. doi: 10.1002/jcb.23259. J Cell Biochem. 2011. PMID: 21748788 Free PMC article.
References
-
- Imai S, Matsusue Y. Neuronal regulation of bone metabolism and anabolism: calcitonin gene-related peptide-, substance P-, and tyrosine hydroxylase-containing nerves and the bone. Microsc Res Tech. 2002;58:61–9. - PubMed
-
- Hill EL, Elde R. Distribution of CGRP-, VIP-, D beta H-, SP-, and NPY-immunoreactive nerves in the periosteum of the rat. Cell Tissue Res. 1991;264:469–80. - PubMed
-
- Mach DB, Rogers SD, Sabino MC, Luger NM, Schwei MJ, Pomonis JD, Keyser CP, Clohisy DR, Adams DJ, O’Leary P, Mantyh PW. Origins of skeletal pain: sensory and sympathetic innervation of the mouse femur. Neuroscience. 2002;113:155–66. - PubMed
-
- Offley SC, Guo TZ, Wei T, Clark JD, Vogel H, Lindsey DP, Jacobs CR, Yao W, Lane NE, Kingery WS. Capsaicin-sensitive sensory neurons contribute to the maintenance of trabecular bone integrity. J Bone Miner Res. 2005;20:257–67. - PubMed
-
- Pearson J, Dancis J, Axelrod F, Grover N. The sural nerve in familial dysautonomia. J Neuropathol Exp Neurol. 1975;34:413–24. - PubMed
MeSH terms
Substances
Grants and funding
LinkOut - more resources
Full Text Sources
Other Literature Sources

