. 2009 May 5;106(18):7624-9.
doi: 10.1073/pnas.0902161106. Epub 2009 Apr 20.

Transcriptome transfer produces a predictable cellular phenotype

Affiliations

Transcriptome transfer produces a predictable cellular phenotype

Jai-Yoon Sul et al. Proc Natl Acad Sci U S A. .

Abstract

Cellular phenotype is the conglomerate of multiple cellular processes involving gene and protein expression that result in the elaboration of a cell's particular morphology and function. It has been thought that differentiated postmitotic cells have their genomes hard wired, with little ability for phenotypic plasticity. Here we show that transfer of the transcriptome from differentiated rat astrocytes into a nondividing differentiated rat neuron resulted in the conversion of the neuron into a functional astrocyte-like cell in a time-dependent manner. This single-cell study permits high resolution of molecular and functional components that underlie phenotype identity. The RNA population from astrocytes contains RNAs in the appropriate relative abundances that give rise to regulatory RNAs and translated proteins that enable astrocyte identity. When transferred into the postmitotic neuron, the astrocyte RNA population converts 44% of the neuronal host cells into the destination astrocyte-like phenotype. In support of this observation, quantitative measures of cellular morphology, single-cell PCR, single-cell microarray, and single-cell functional analyses have been performed. The host-cell phenotypic changes develop over many weeks and are persistent. We call this process of RNA-induced phenotype changes, transcriptome-induced phenotype remodeling.


Conflict of interest statement

Conflict of interest: William T. Greenough and J.E. have collaborated on past research. They are not currently collaborating. The remaining authors declare no conflict of interest.

Figures
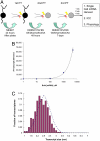
Fig. 1.
Fig. 1.
Modeling of TIPeR process. (A) The first phototransfection was performed on hippocampal neurons with local delivery of the astrocyte transcriptome. The same procedure was repeated 48 h and 7 days after the first phototransfection. Single-cell mRNA harvesting, immunocytochemistry, and physiological assessment were performed at various times after the third phototransfection. (B) Given the ability to control transport of molecules across the plasma membrane through both the number of pulses and extracellular concentrations, simulations were conducted to estimate the efficacy of mRNA transfer through a standard phototransfection pulse. (C) The dashed line is the histogram showing the size distribution of the transcripts in solution during phototransfection. The bars show the amount of the transcript delivered into the cytosol. There is a slight reduction in delivery efficiency of the largest transcripts, as their sizes are on the order of the assumed size of the phototransfection pore. For a transcriptome that contained a large range of transcript sizes, simulations indicated that the relative composition of the delivered cargo to the cytosol would largely remain intact.
Fig. 2.
Fig. 2.
N-TIPeR-AS cells coexpressed astrocytic and neuronal mRNA and protein markers. (A) Single-cell RT-PCR was performed on N-TIPeR-AS cells at different time points to detect the expression of GFAP and MAP2 genes. Age was defined as time after the third phototransfection. “+” indicates the presence of GFAP or MAP2 mRNA., GFAP-positive cells are highlighted with shadows. Population brain-cortex cells containing both neurons and astrocytes were used as positive control and water was the negative control. (B) The representative N-TIPeR-AS cell is immunoreactive for all NeuN, GFAP, and fibronectin antibodies 2 weeks after the third phototransfection. (Scale bar, 10 μm.) (C) The table shows the immunoreactivity of Dynamin 1 and GFAP in the astrocyte (red triangle), the neuron (blue square), and the TIPeR cell (green circle). The graph shows that integrated immunofluorescence signal from regions of interest. The TIPeR cells are clustered with the astrocytes and are distinct from the neuron cluster.
Fig. 3.
Fig. 3.
Global gene expression patterns of TIPeR cells. (A) Unweighted Pair Group Method with Arithmetic (UPGMA) clustering of the cell conditions on 3,104 informative genes, with major branches labeled with bootstrap support, indicating confidence in each cluster. Leaves are colored according to cell type: (green) neurons, (purple) N-TIPeR-N controls, (blue) TIPeRed cells, (orange) astrocytes. (B) We visualized the 3,104-dimensional standard-gene space by reducing the high-dimensional coordinates to 3 dimensions of biological interest: the first axis represents genes most variable for astrocyte vs. neurons, the second axis represents genes most variable between the TIPeR cells (i.e., representing TIPeR treatment variability), and the third axis representing overall variability of all cells [(red) astrocytes, (orange) neurons, (blue) control. (yellow) astro-TIPeR (i.e., the TIPeR cells clustering closest to the astrocytes as shown in the dendrogram in A), (green) neuro-TIPeR]. The transparent “cloud” around the points shows nonparametric density contours. (see Materials and Methods). (C) Heatmap showing intensity of 512 distinguishing probes (see Materials and Methods) across astrocytes (Astro), astro-TIPeRs (astro-TIPeR), N-TIPeR-N controls (Ctrl), and neurons (Neuro). Probes are separated by white lines into 4 groups according to the intensities of the astro-TIPeR cells compared to the intensities of the neurons and the astrocytes: (I) astro-TIPeR expression is similar to astrocytes but not neurons (201 probes); (II) astro-TIPeR expression is intermediate between astrocytes and neurons (77 probes); (III) astro-TIPeR expression is similar to neurons but not astrocytes (202 probes); (IV) astro-TIPeR expression is dissimilar to both neurons and astrocytes (32 probes). Each lane is the data from an individual cell. (D) Heatmap of 171 probes that are significantly quiescent in both astrocytes (Astro) and neurons (Neuro); followed by TIPeR cells 1 week (TIPeR 1w), 2 weeks (TIPeR 2w), and 4 weeks (TIPeR 4w) after phototransfection, and for control cells (Ctrl). These genes show significant de novo up-regulation in TIPeR cells, especially in 1-week cells. No de novo up-regulation is seen in control cells. Each lane is the data from an individual cell.
Fig. 4.
Fig. 4.
Morphological analysis of TIPeR cells. (A) DIC images of representative N-TIPeR-N cell (Left) and N-TIPeR-AS cell (Right) demonstrate that the N-TIPeR-AS cell shows significant decreased overall size, including retraction of all its processes while the N-TIPeR-N cell only shows a slightly decreased cell size with most of its processes intact. (Scale bar, 20 μm.) (B) N-TIPeR-AS cells show significant decrease in relative size when comparing to that of N-TIPeR-N cultured in the neuronal media or in the astrocyte media. The y-axis is the percentage of change in overall cell size when comparing that of post-TIPeR to the initial cell size. Error bars represent the value of the SEM. (*P < 0.05) (C) Process retraction occurs for N-TIPeR-AS cells with 65% of N-TIPeR-AS cells showing retraction of their processes while only 40% of N-TIPeR-N cells cultured in the astrocyte medium and 20% of N-TIPeR-N cells cultured in the neuronal medium (NB) retracted their processes.
Fig. 5.
Fig. 5.
N-TIPeR-AS cells display astrocyte-like physiological responses. The percentage of N-TIPeR-AS cells displaying astrocyte-like calcium fluctuation pattern [at least 5% increase in Fluo-4 intensity only upon glutamate (500 μM) but not KCl (50 mM) application] increased with time after the third phototransfection elongated (blue line). The percentage of N-TIPeR-AS cells still displaying neuron-like calcium fluctuation pattern (at least 5% increase in Fluo-4 a.m. intensity upon both glutamate and KCl application) decreased with time after the third phototransfection (red line). Nonspecified N-TIPeR-AS cells are the cells that show no detectable change upon glutamate application (green line). The y-axis represents the percentage of N-TIPeR-AS cells tested falling into these 3 groups at a given time point. Error bars are the SEM.

References

    1. Waddington. The Strategy of the Genes: a Discussion of Some Aspects of Theoretical Biology. London: George Allen & Unwin; 1957.
    1. Gurdon JB, Elsdale TR, Fischberg M. Sexually mature individuals of Xenopus laevis from the transplantation of single somatic nuclei. Nature. 1958;182(4627):64–65. - PubMed
    1. Takahashi K, Yamanaka S. Induction of pluripotent stem cells from mouse embryonic and adult fibroblast cultures by defined factors. Cell. 2006;126(4):663–676. - PubMed
    1. Huangfu D, et al. Induction of pluripotent stem cells from primary human fibroblasts with only Oct4 and Sox2. Nat Biotechnol. 2008;26(11):1269–1275. - PubMed
    1. Kim JB, et al. Pluripotent stem cells induced from adult neural stem cells by reprogramming with two factors. Nature. 2008;454(7204):646–650. - PubMed

Publication types

LinkOut - more resources