. 2009 May 1;182(9):5240-9.
doi: 10.4049/jimmunol.0803245.

PD-1 is a regulator of NY-ESO-1-specific CD8+ T cell expansion in melanoma patients

Affiliations

PD-1 is a regulator of NY-ESO-1-specific CD8+ T cell expansion in melanoma patients

Julien Fourcade et al. J Immunol. .

Abstract

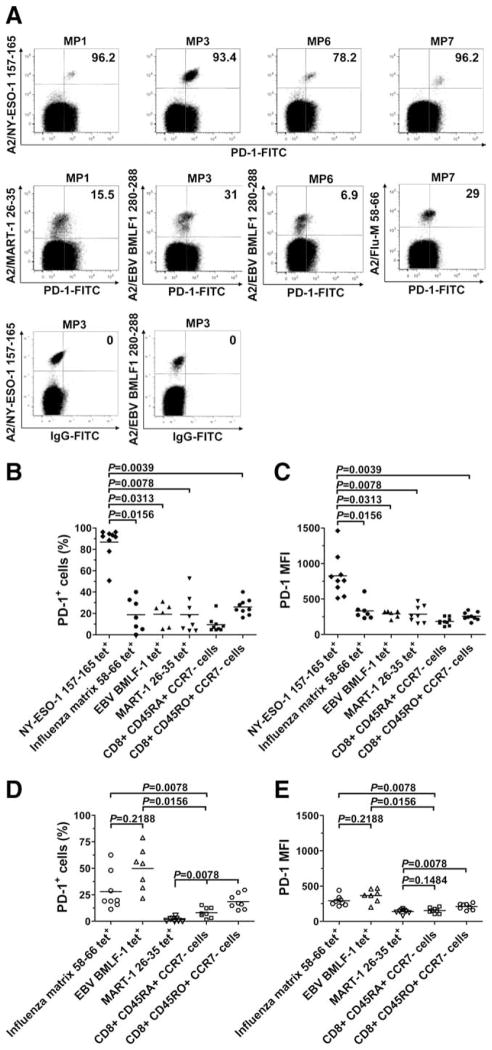
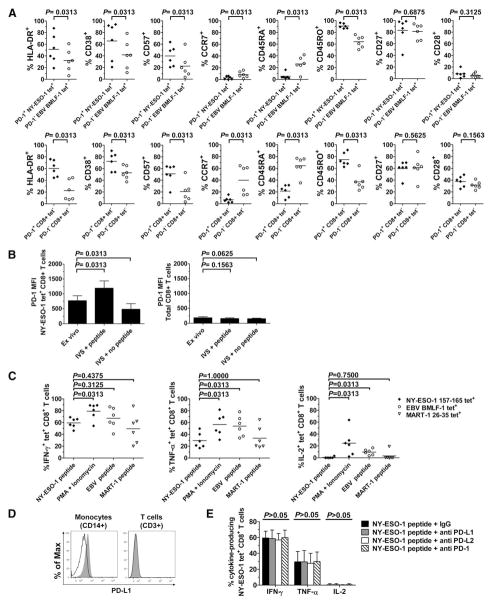
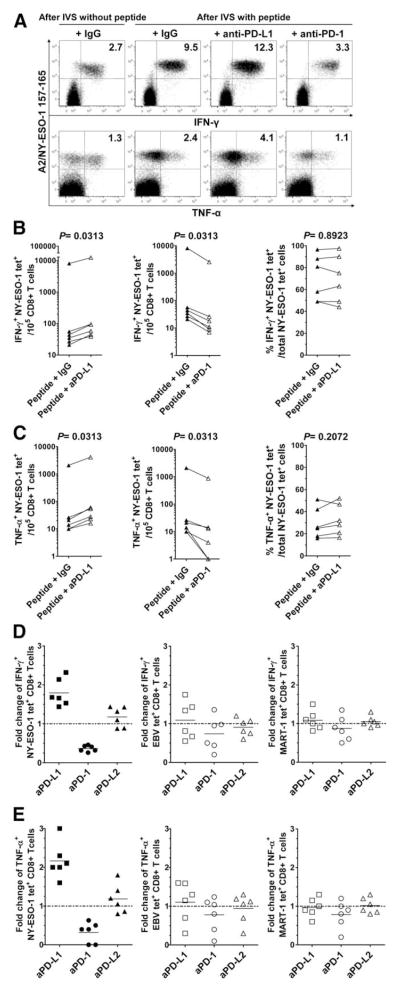
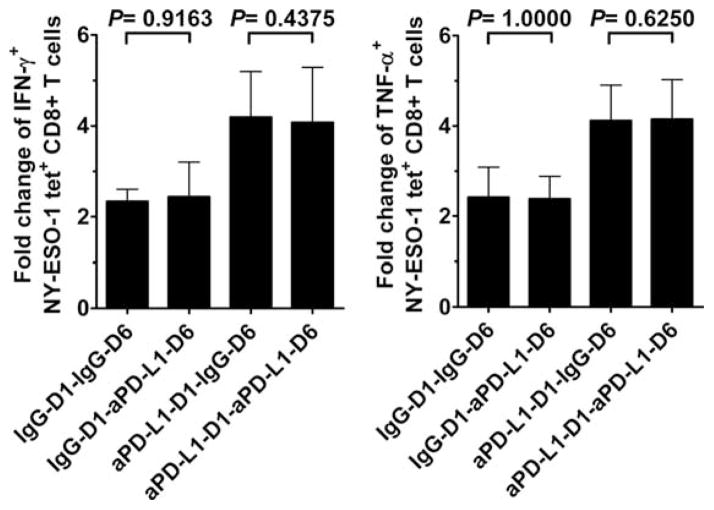
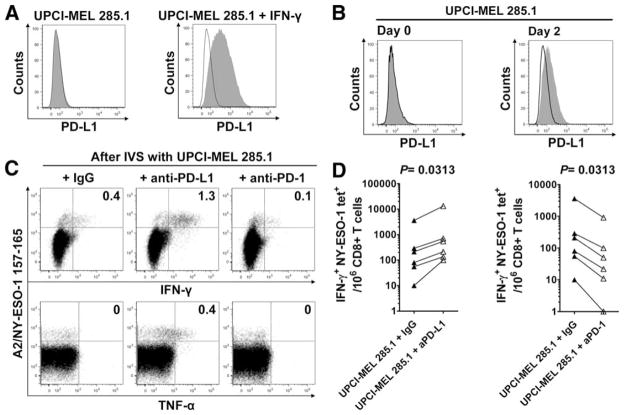
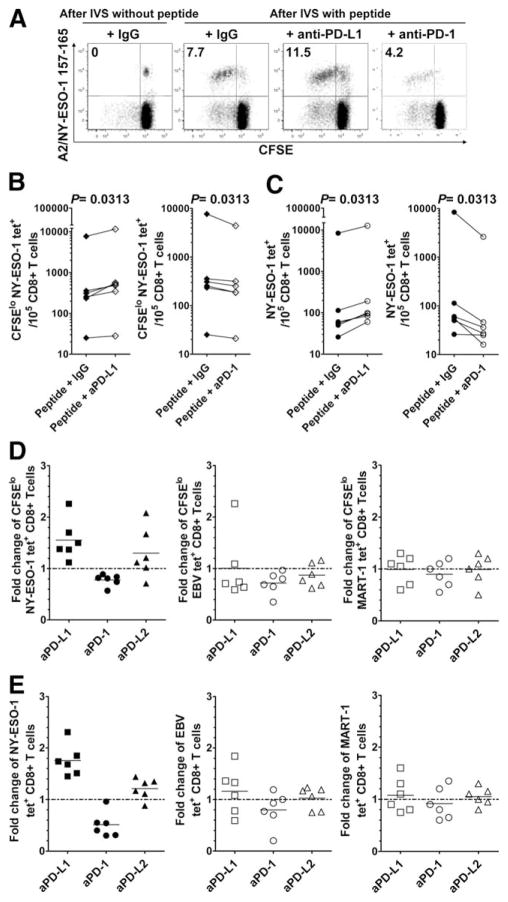
The programmed death 1 (PD-1) receptor is a negative regulator of activated T cells and is up-regulated on exhausted virus-specific CD8(+) T cells in chronically infected mice and humans. Programmed death ligand 1 (PD-L1) is expressed by multiple tumors, and its interaction with PD-1 resulted in tumor escape in experimental models. To investigate the role of PD-1 in impairing spontaneous tumor Ag-specific CD8(+) T cells in melanoma patients, we have examined the effect of PD-1 expression on ex vivo detectable CD8(+) T cells specific to the tumor Ag NY-ESO-1. In contrast to EBV, influenza, or Melan-A/MART-1-specific CD8(+) T cells, NY-ESO-1-specific CD8(+) T cells up-regulated PD-1 expression. PD-1 up-regulation on spontaneous NY-ESO-1-specific CD8(+) T cells occurs along with T cell activation and is not directly associated with an inability to produce cytokines. Importantly, blockade of the PD-1/PD-L1 pathway in combination with prolonged Ag stimulation with PD-L1(+) APCs or melanoma cells augmented the number of cytokine-producing, proliferating, and total NY-ESO-1-specific CD8(+) T cells. Collectively, our findings support the role of PD-1 as a regulator of NY-ESO-1-specific CD8(+) T cell expansion in the context of chronic Ag stimulation. They further support the use of PD-1/PD-L1 pathway blockade in cancer patients to partially restore NY-ESO-1-specific CD8(+) T cell numbers and functions, increasing the likelihood of tumor regression.


Conflict of interest statement

Disclosures

The authors have no financial conflicts of interest.

Figures

FIGURE 1
FIGURE 1
PD-1 expression is up-regulated on NY-ESO-1-specific CD8+ T cells. A, Representative dot plots from different melanoma patients (MP) showing PD-1 expression on HLA-A2 (A2)/NY-ESO-1157–165 tet+, A2/EBV-BMLF1280–288, A2/Flu-M58–66, and A2/MART-126 –35 tet+CD8+ T cells (upper panels). Representative examples of NY-ESO-1 tet+ and EBV tet+CD8+ T cells stained with a FITC-labeled isotype IgG control Ab are also displayed and were used to establish the threshold for identifying PD-1+ cells (lower panel). Values indicate the percentage of CD8+ T cells expressing PD-1 among tet+ cells. BE, Pooled data showing the percentage and MFI of PD-1 expression on NY-ESO-1-, Flu-, EBV-, and MART-1-specific as well as total effector (CD45RA+CCR7) and effector memory (CD45RO+CCR7) CD8+ T cells from nine melanoma patients (B and C) and eight healthy donors (D and E). Horizontal bars depict the mean percentage and MFI of PD-1 expression on tet+CD8+ T cells. The p values were calculated using the Wilcoxon signed rank test.
FIGURE 2
FIGURE 2
Activation, maturational, and functional status of NY-ESO-1-specific CD8+ T cells. A, Pooled data from melanoma patients (n = 6) showing expression of HLA-DR, CD38, CD57, CCR7, CD45RA, CD45RO, CD27, and CD28 on PD-1+ NY-ESO-1-specific and PD-1 EBV-specific CD8+ T cells (upper panel) as well as on PD-1+ and PD-1 tetCD8+ T cells (lower panel). Horizontal bars depict the mean percentage of cells that express the corresponding marker. B, Pooled data showing the mean MFI and SD of PD-1 expression by A2/NY-ESO-1157–165 tet+ (left panel) and total (right panel) CD8+ T cells assessed either ex vivo or after 6-day IVS with or without cognate peptide (n = 6). C, Pooled data showing percentages of Ag-specific tet+CD8+ T cells that produce IFN-γ, TNF-α, and IL-2 ex vivo in the presence of cognate peptide-pulsed APCs or PMA plus ionomycin (n = 6). Horizontal bars depict the mean percentage of tet+CD8+ T cells that produce cytokines. D, Histograms showing ex vivo expression of PD-L1 by monocytes isolated from PBMCs of one representative melanoma patient. Cells were stained either with anti-PD-L1 Abs (gray) or an isotype control Ab (black line) and analyzed by flow cytometry. As controls, T cells (CD3+ cells) do not express PD-L1. E, Summary data for melanoma patients (n = 6) showing the mean percentage and SD of A2/NY-ESO-1157–165 tet+CD8+ T cells that produce IFN-γ, TNF-α, and IL-2 ex vivo after stimulation with cognate peptide-pulsed APCs and with Abs against PD-L1, PD-L2, PD-1, or an isotype control (IgG). The p values were calculated using the Wilcoxon signed rank test.
FIGURE 3
FIGURE 3
Blockade of the PD-1/PD-L1 pathway significantly increases frequency of cytokine-producing NY-ESO-1-specific CD8+ T cells. A, Representative flow cytometry analysis from one melanoma patient (MP3) showing percentages of IFN-γ- and TNF-α-producing A2/NY-ESO-1157–165 tet+CD8+ T cells among total CD8+ T cells and (B and C), pooled data from melanoma patients (n = 6) showing the variation in the number of IFN-γ- and TNF-α-producing NY-ESO-1 tet+ cells for 105 CD8+ T cells (left and center panels), and the percentages of NY-ESO-1 tet+CD8+ T cells that produce IFN-γ and TNF-α among total NY-ESO-1 tet+CD8+ T cells (right panels). PBMCs were incubated for 6 days with (After IVS with peptide) or without (After IVS without peptide) peptide NY-ESO-1157–165 and Abs against PD-L1 (aPD-L1), PD-L2, PD-1 (aPD-1), or an isotype control (IgG) before evaluating intracellular cytokine production of NY-ESO-1 tet+CD8+ T cells in response to cognate peptide. D and E, Fold change of the number of IFN-γ- and TNF-α-producing NY-ESO-1, EBV, and MART-1 tet+CD8+ T cells after 6-day IVS with cognate peptide and Abs against PD-L1, PD-L2, PD-1, or an isotype control Ab. The ratio of the number of cytokine-producing tet+CD8+ T cells from melanoma patients (n = 6) in the presence of indicated Ab treatment and isotype control Ab is shown. The p values were calculated using the Wilcoxon signed rank test.
FIGURE 4
FIGURE 4
Effect of PD-1/PD-L1 pathway blockade performed after IVS on the frequency of cytokine-producing NY-ESO-1-specific CD8+ T cells. Summary data from melanoma patients (n = 6) showing the mean fold change and SD in the number of IFN-γ-producing (IFN-γ+) and TNF-α-producing (TNF-α+) NY-ESO-1 tet+CD8+ T cells after 6-day stimulation with peptide NY-ESO-1157–165 in the presence of anti-PD-L1 or isotype control Abs added at day 1 (D1) and/or at day 6 (D6) before restimulation with cognate peptide and intracellular cytokine staining of NY-ESO-1 tet+CD8+ T cells. The ratio of cytokine-producing NY-ESO-1 tet+CD8+ T cells per 105 total CD8+ T cells measured after 6-day IVS with and without cognate peptide is displayed. The p values were calculated using the Wilcoxon signed rank test.
FIGURE 5
FIGURE 5
PD-1/PD-L1 pathway blockade increases the number of cytokine-producing NY-ESO-1-specific CD8+ T cells upon stimulation with NY-ESO-1-expressing tumor cells. A, Up-regulation of PD-L1 expression by the HLA-A2+NY-ESO-1+ UPCI-MEL 285.1 melanoma cells upon treatment with IFN-γ. Melanoma cells were cultured without (left) or with (right) IFN-γ (500 IU/ml) for 48 h, stained with anti-PD-L1 Abs (gray) or an isotype control Ab (black line), and analyzed by flow cytometry. B, Expression of PD-L1 by the HLA-A2+NY-ESO-1+ UPCI-MEL 285.1 melanoma cells before (Day 0) and after (Day 2) incubation with CD8+ T cells purified from PBMCs of one HLA-A2+ melanoma patient (MP3) with spontaneous NY-ESO-1-specific CD8+ T cells. Melanoma cells were stained with anti-PD-L1 Abs (gray) or with an isotype control Ab (black line) and analyzed by flow cytometry. C, Representative flow cytometry analysis from one melanoma patient (MP3) showing percentages of IFN-γ- and TNF-α-producing A2/NY-ESO-1157–165 tet+ cells among total CD8+ T cells, and (D) pooled data from melanoma patients (n = 6) showing the variation in the number of IFN-γ-producing NY-ESO-1 tet+ cells for 106 CD8+ T cells in the presence of UPCI-MEL 285.1 cells after 6-day IVS with UPCI-MEL 285.1 cells and anti-PD-L1 (aPD-L1), anti-PD-1 (aPD-1), or isotype control Abs (IgG). The p values were calculated using the Wilcoxon signed rank test.
FIGURE 6
FIGURE 6
PD-1/PD-L1 pathway blockade significantly increases the frequency of proliferating and total NY-ESO-1-specific CD8+ T cells. A, Representative flow cytometry analysis from one melanoma patient (MP3) showing percentages of CFSElow NY-ESO-1 tet+CD8+ T cells among total CD8+ T cells, and (B and C) pooled data from melanoma patients (n = 6) showing the variation in the number of CFSElow and total NY-ESO-1 tet+ cells for 105 CD8+ T cells. CFSE-labeled PBMCs were incubated for 6 days with (After IVS with peptide) or without (After IVS without peptide) peptide NY-ESO-1157–165 and Abs against PD-L1 (aPD-L1), PD-L2, PD-1 (aPD-1), or an isotype control (IgG). D and E, Fold change of the number of CFSElow (D) and total (E) NY-ESO-1, EBV, and MART-1 tet+CD8+ T cells after 6-day IVS with cognate peptide and Abs against PD-L1, PD-L2, PD-1, or an isotype control (n = 6). The ratio of the number of CFSElow and total NY-ESO-1, EBV, and MART-1 tet+CD8+ T cells in the presence of indicated Ab treatment and isotype control Ab is shown. The p values were calculated using the Wilcoxon signed rank test.

References

    1. Boon T, Coulie PG, Van den Eynde BJ, van der Bruggen P. Human T cell responses against melanoma. Annu Rev Immunol. 2006;24:175–208. - PubMed
    1. Haas GG, Jr, D’Cruz OJ, De Bault LE. Distribution of human leukocyte antigen-ABC and -D/DR antigens in the unfixed human testis. Am J Reprod Immunol Microbiol. 1988;18:47–51. - PubMed
    1. Jager E, Nagata Y, Gnjatic S, Wada H, Stockert E, Karbach J, Dunbar PR, Lee SY, Jungbluth A, Jager D, et al. Monitoring CD8 T cell responses to NY-ESO-1: correlation of humoral and cellular immune responses. Proc Natl Acad Sci USA. 2000;97:4760– 4765. - PMC - PubMed
    1. Stockert E, Jager E, Chen YT, Scanlan MJ, Gout I, Karbach J, Arand M, Knuth A, Old LJ. A survey of the humoral immune response of cancer patients to a panel of human tumor antigens [see comments] J Exp Med. 1998;187:1349–1354. - PMC - PubMed
    1. Jager E, Stockert E, Zidianakis Z, Chen YT, Karbach J, Jager D, Arand M, Ritter G, Old LJ, Knuth A. Humoral immune responses of cancer patients against “Cancer-Testis” antigen NY-ESO-1: correlation with clinical events. Int J Cancer. 1999;84:506–510. - PubMed

Publication types

MeSH terms