

doi: 10.1182/blood-2008-12-192997.
Epub 2009 Apr 20.
IL-15 produced and trans-presented by DCs underlies homeostatic competition between CD8 and {gamma}{delta} T cells in vivo
Affiliations
- PMID: 19380870
- PMCID: PMC2710929
- DOI: 10.1182/blood-2008-12-192997
Item in Clipboard
IL-15 produced and trans-presented by DCs underlies homeostatic competition between CD8 and {gamma}{delta} T cells in vivo
Blood.
.
Abstract
Homeostatic mechanism by which peripheral T-cell subsets are maintained in vivo remains largely unknown. Using a T-cell proliferation model under lymphopenic settings, we now demonstrate that gammadelta T cells limit CD8 T-cell expansion but not the initial proliferation after transfer into lymphopenic recipients. Interleukin-15 (IL-15) produced by and trans-presented on the membrane of the CD11c(+) dendritic cells (DCs) is the key factor that mediates homeostatic competition between CD8 and gammadelta T cells, revealing previously unrecognized IL-15-dependent homeostatic mechanisms between different T-cell subsets in vivo.
Figures
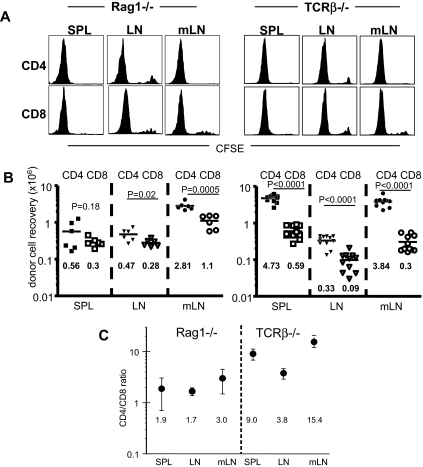
Differential proliferative response of naive T cells in Rag1−/− or TCRβ−/− lymphopenic recipients. (A) CFSE profiles of adoptively transferred Ly5.1 naive T cells. Cells were collected 7 days after transfer from the indicated lymphoid tissues. Shown are the CFSE profiles of Ly5.1+ gated donor T cells. (B) Absolute numbers of donor cells were calculated. Each symbol represents individual recipient mice. Mean cell recovery (×106) ± SD of CD4 T cells and CD8 T cells in spleen of Rag1−/− mice: 0.56 ± 0.46 and 0.3 ± 0.08, respectively (P = .18). Mean cell recovery (×106) ± SD of CD4 T cells and CD8 T cells in spleen of TCRβ−/− mice: 4.73 ± 1.04 and 0.59 ± 0.22, respectively (P < .001). Mean cell recovery (×106) ± SD of CD4 T cells and CD8 T cells in LN of Rag1−/− mice: 0.47 ± 0.18 and 0.28 ± 0.06, respectively (P = .02). Mean cell recovery (×106) ± SD of CD4 T cells and CD8 T cells in LN of TCRβ−/− mice: 0.33 ± 0.1 and 0.09 ± 0.05, respectively (P < .001). Mean cell recovery (×106) ± SD of CD4 T cells and CD8 T cells in mesenteric LN of Rag1−/− mice: 2.81 ± 0.71 and 1.1 ± 0.43, respectively (P < .001). Mean cell recovery (×106) ± SD of CD4 T cells and CD8 T cells in mesenteric LN of TCRβ−/− mice: 3.84 ± 1.1 and 0.3 ± 0.16, respectively (P < .001). (C) The ratio of adoptively transferred donor CD4 and CD8 T cells in the spleen, the LN and the mesenteric LN was calculated. Shown are the mean ± SD of individually tested mice (n = 6-11).
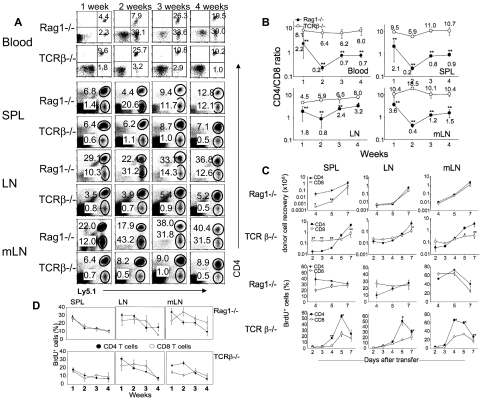
Kinetic of CD4 and CD8 proliferation in different lymphopenic hosts. (A,B) Cells from the blood, spleen, LN, and mesenteric LN at the indicated times after transfer were stained for Ly5.1 and CD4. The results are representative of 3 individual mice per group. The ratio of transferred donor cells was analyzed at every week after transfer. Shown are the mean ± SD of individually tested mice (n = 3). (C,D) Groups of Rag1−/− and TCRb−/− mice were transferred with naive Ly5.1 T cells, and killed at the indicated time points after the transfer. Total cell recovery as well as BrdU incorporation was determined as described in “Flow cytometry.” Shown are the mean ± SD of individually tested mice (n = 3). *P < .05; **P < .01.
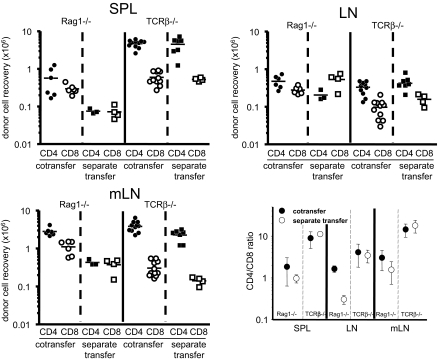
Proliferative responses of naive CD4 and CD8 T cells after cotransfer of separate transfer. Groups of Rag1−/− and TCRβ−/− recipients were transferred with 106 Ly5.1 naive T cells (cotransfer). Another group of mice were transferred with either 0.5 × 10⁶ Ly5.1 naive CD4 or CD8 cells (separate transfer). The total cell recovery as well as the CD4/CD8 ratio in the indicated tissues was analyzed 7 days after transfer. Each symbol represents individual recipient mice. Shown are the mean ± SD of individually tested mice (n = 3-11).
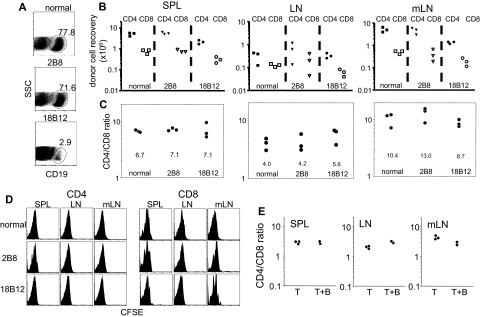
Roles of B cells in naive T-cell proliferation in lymphopenic conditions. (A) Groups of TCRβ−/− mice were injected intravenously with 18B12 (B cell depleting) or 2B8 (isotype control) Abs (250 μg per recipient). Splenic B cells were analyzed by CD19 staining 7 days after the Ab injection. (B) TCRβ−/− recipients injected with 18B12, 2B8, or none received 106 Thy1.1 naive CD4 and CD8 T cells 7 days after the Ab injection. Donor cell recovery was calculated 7 days after T-cell transfer. Each symbol represents individual recipient mice. (C) The ratio of adoptively transferred donor cells in the indicated tissues was analyzed. (D) CFSE profiles of donor Thy1.1 cells within TCRβ−/− recipients treated with antibodies are shown. The results are representative of at least 3 individual mice per group. (E) Splenic B cells were cotransferred (5 × 10⁶ cells) together with naive T cells into Rag1−/− recipients. After day 7, the ratio of adoptively transferred donor cells in the spleen, LN, and mesenteric LN was analyzed by staining Ly5.1 and CD4. Each symbol represents individual recipient mice.
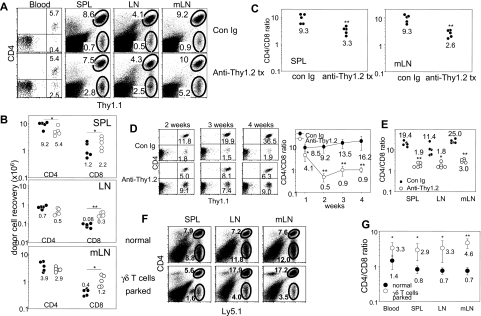
Roles of γδ T cells in naive T-cell proliferation in lymphopenic conditions. (A) Groups of TCRβ−/− recipients were injected with anti-Thy1.2 Ab (500 μg at days −2, 1, and 3) and subsequently transferred with 106 Thy1.1 naive CD4 and CD8 T cells (at day 0). Cells from the indicated tissues were harvested 7 days after T-cell transfer and stained for Thy1.1 and CD4. Dot plots are representative of 5 individually tested mice. (B) Total cell recovery of transferred T cells was calculated by FACS analysis; control Ig (●) or anti-Thy1.2 (○). (C) The ratio of donor T cells recovered from the spleen and mesenteric LN are shown. Each symbol represents individually tested mice from at least 2 independent experiments. (D) Groups of mice treated with anti-Thy1.2 Ab and transferred with naive T cells as described above were bled every week for 4 weeks and analyzed for relative expansion of each donor T-cell subset. The results are representative of at least 2 separate experiments involving 2 to 3 mice per group. (E) Ratio of CD4 and CD8 T cells in γδ T cells depleted (anti-Thy1.2) mice after 4 weeks was calculated. Each symbol represents individual recipients. *P < .05; **P < .01. (F) 3 × 10⁶ γδ T cells were isolated from TCRβ−/− mice and transferred into groups of Rag1−/− recipients. Ly5.1 naive T cells were adoptively transferred into these mice 14 days after the γδ T-cell transfer. Expansion of Ly5.1 T cells was analyzed 7 days after the transfer (G) The ratio of donor CD4 and CD8 T cells in mice that received γδ T cells before naive T-cell transfer was calculated. The results are representative of 4 to 6 mice from 2 separate experiments. *P < .05; **P < .01. Shown are the mean ± SD of individually tested mice.
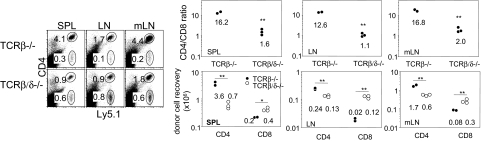
Naive T-cell proliferation and expansion in mice deficient in TCRβ/δ. Ly5.1 naive T cells (106) were adoptively transferred into TCRβ−/− and TCRβ/δ−/− recipients. The FACS profiles, the ratio, and the total cell recovery of donor CD4 and CD8 T cells were analyzed 7 days after transfer. Each symbol represents individual mice. *P < .05; **P < .01.
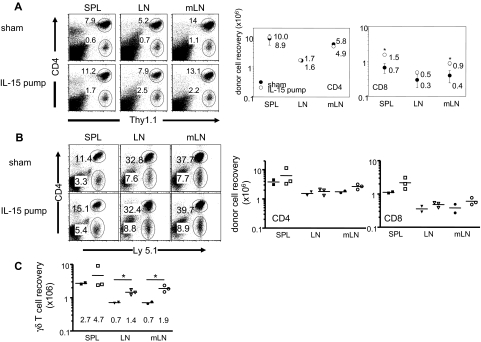
Exogenous IL-15 enhances CD8 T-cell expansion. (A) Groups of TCRβ−/− mice that receive Thy1.1 naive T cells were implanted with a miniosmotic pump containing 5 μg rmIL-15. Mice were killed 3 weeks after pump implantation. Tissue cells were stained for Thy1.1 and CD4. Total T-cell recovery was determined by FACS analysis. Shown are the mean ± SD of 3 to approximately 4 individually tested mice. (B) Groups of Rag1−/− mice received 3 × 10⁶ γδ T cells at day 0, 106 naive T cells at day 14 together with a miniosmotic pump containing 5 μg rmIL-15. Mice were killed 14 days after the pump treatment. Total cell recovery of donor CD4 and CD8 T cells was determined by FACS analysis. (C) Total γδ T-cell recovery was also determined by FACS analysis. Each symbol represents individual mice. *P < .05.
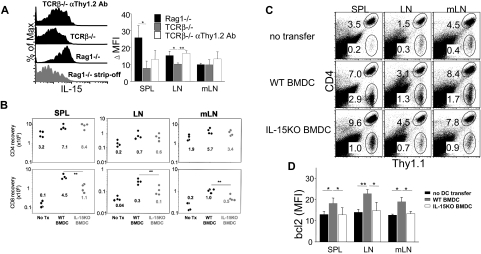
Roles of IL-15 and DCs in CD8 T-cell proliferation. (A) Expression of membrane bound IL-15 on the splenic CD11c+ DCs of Rag1−/− mice, TCRβ−/− mice, and TCRβ−/− mice treated with anti-Thy1.2 Ab every 4 days for 2 weeks before sacrifice was examined as described in“Methods.” Cells were washed with acid PBS to strip off membrane bound IL-15. IL-15 staining was repeated to validate the staining. The results are representative from 3 independent experiments. (B) BMDCs (wild-type or IL-15−/−) were generated as described in “BMDCs” and adoptively transferred (5 × 10⁶ DCs) together with 106 Thy1.1 naive T cells into TCRβ−/− recipients. Dot plots are representative of 6 to 7 individually tested mice from 2 independent experiments. (C) Total CD4 and CD8 T-cell recovery was calculated from the indicated tissues 7 days after transfer. Each symbol represents individual recipient. (D) Intracellular bcl-2 expression of CD8 T cells was determined at 14 days after transfer of naive T cells and BMDCs derived from wild-type or IL-15−/− mice into TCRβ−/− recipients. *P < .05; **P < .01. Shown are the mean ± SD of individually tested mice (n = 3 to ∼ 4).
References
-
- Freitas AA, Rocha B. Population biology of lymphocytes: the flight for survival. Annu Rev Immunol. 2000;18:83–111. - PubMed
-
- Boyman O, Purton JF, Surh CD, Sprent J. Cytokines and T-cell homeostasis. Curr Opin Immunol. 2007;19:320–326. - PubMed
-
- Ma A, Koka R, Burkett P. Diverse functions of IL-2, IL-15, and IL-7 in lymphoid homeostasis. Annu Rev Immunol. 2006;24:657–679. - PubMed
-
- Lee SK, Surh CD. Role of interleukin-7 in bone and T-cell homeostasis. Immunol Rev. 2005;208:169–180. - PubMed
-
- Lodolce J, Burkett P, Koka R, et al. Interleukin-15 and the regulation of lymphoid homeostasis. Mol Immunol. 2002;39:537–544. - PubMed
Publication types
MeSH terms
Substances
Grants and funding
LinkOut - more resources
Full Text Sources
Other Literature Sources
Molecular Biology Databases
Research Materials
