. 2009 Jul;182(3):685-98.
doi: 10.1534/genetics.109.103093. Epub 2009 Apr 20.

Telomeric RNAs mark sex chromosomes in stem cells

Affiliations

Telomeric RNAs mark sex chromosomes in stem cells

Li-Feng Zhang et al. Genetics. 2009 Jul.

Abstract

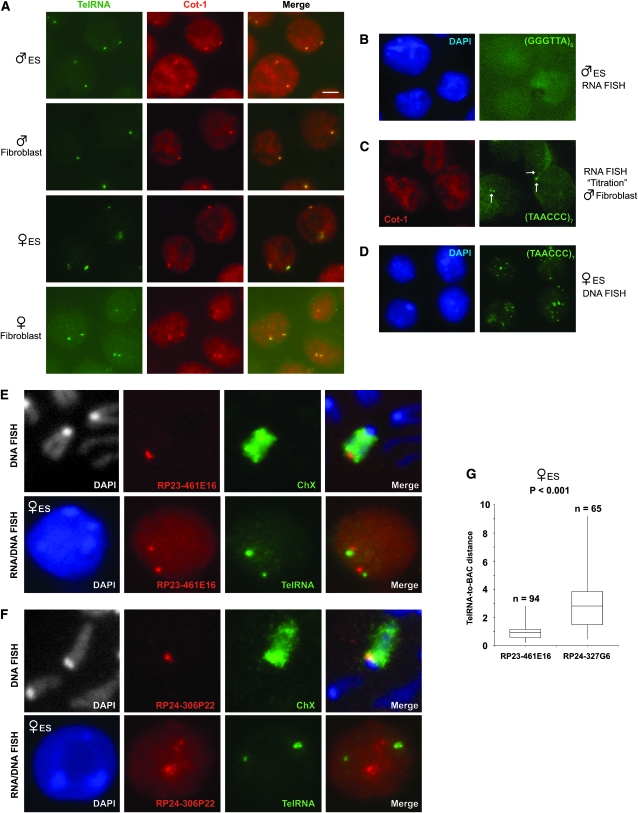
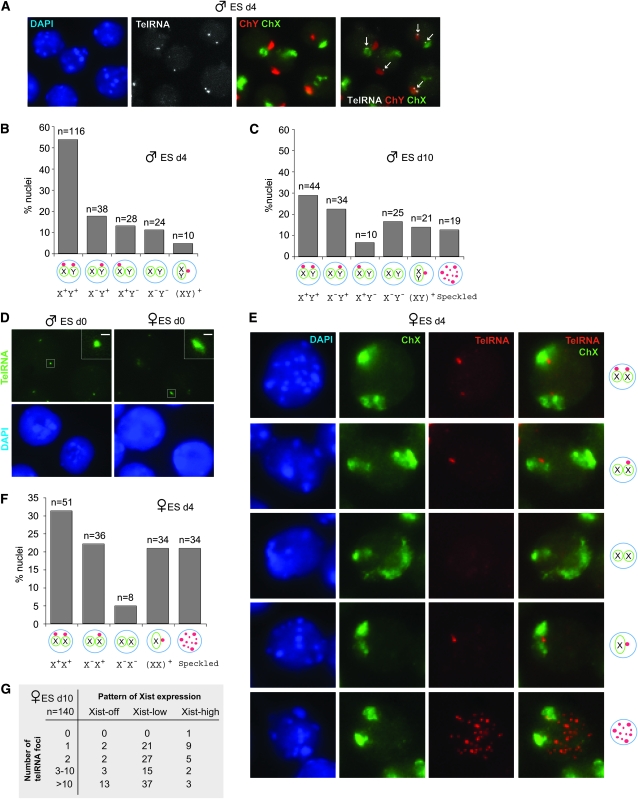
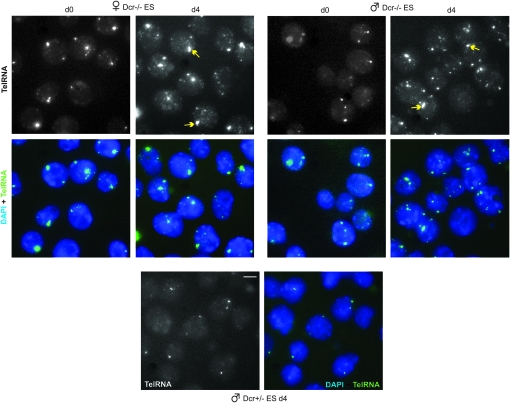
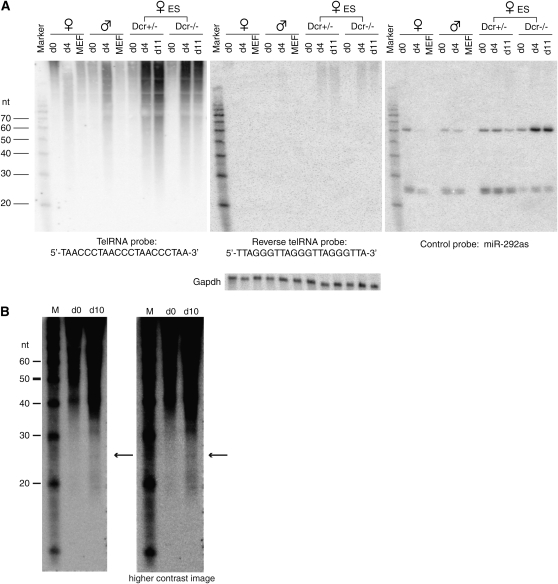
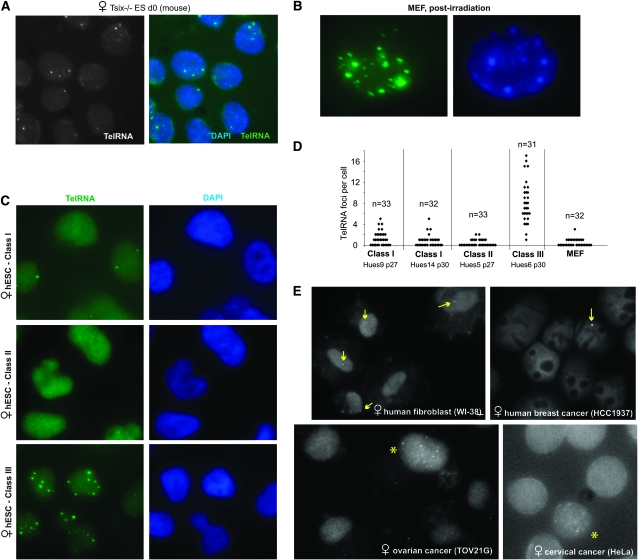
Telomeric regions are known to be transcribed in several organisms. Although originally reported to be transcribed from all chromosomes with enrichment near the inactive X of female cells, we show that telomeric RNAs in fact are enriched on both sex chromosomes of the mouse in a developmentally specific manner. In female stem cells, both active Xs are marked by the RNAs. In male stem cells, both the X and the Y accumulate telomeric RNA. Distribution of telomeric RNAs changes during cell differentiation, after which they associate only with the heterochromatic sex chromosomes of each sex. FISH mapping suggests that accumulated telomeric RNAs localize at the distal telomeric end. Interestingly, telomeric expression changes in cancer and during cellular stress. Furthermore, RNA accumulation increases in Dicer-deficient stem cells, suggesting direct or indirect links to RNAi. We propose that telomeric RNAs are tied to cell differentiation and may be used to mark pluripotency and disease.


Figures

F<sc>igure</sc> 1.—
Figure 1.—
A Cot-1 RNA attachment to sex heterochromatin in the mouse. (A) Sequential RNA/DNA FISH in transformed female fibroblasts. Note: SV40-transformed fibroblasts are often tetraploid. RNA FISH to detect Cot-1 pinpoints (Cy3, white arrow) and Xist RNA (FITC) was followed by slide denaturation and DNA FISH using an X chromosome paint (FITC) to detect all Xs (yellow arrows). Examples of Cot-1 holes indicated by green arrowheads. Images are merged z-stacks. Scale bar, 2 μm. (B) Magnification of a nucleus to demonstrate the spatial relationship between the Xi and the Cot-1 body. (C) RNAseA treatment prior to FISH abolishes the Cot-1 signals. (D) Patterns of Cot-1 expression in transformed female fibroblasts. n = 67. (E) Frequency of Cot-1 pinpoint attachment to Xi vs. Xa. (F) Sequential RNA/DNA FISH in primary male fibroblasts. RNA FISH to detect Cot-1 pinpoints (Cy3) was followed by DNA FISH using an X (FITC) and Y (Cy3, pseudocolored blue) paint. (G) Magnification of a nucleus to demonstrate spatial relationship between the Cot-1 pinpoint and the Y. (H) Patterns of Cot-1 pinpoint expression in primary male fibroblasts. n = 121.
F<sc>igure</sc> 2.—
Figure 2.—
Relationship between Cot-1 bodies and X inactivation. (A) Summary of Cot-1 localization in male fibroblast cell lines carrying Xic transgenes on an autosome (ATg). Right column indicates the percentage of the Xist-expressing chromosome (either X or autosomal) that is associated with a Cot-1 RNA focus. (B) RNA FISH of a representative nucleus (π2.5.5 clone) combining a Cot-1 (Cy3) and Xist (FITC) probes. Cot-1 foci and autosomal Xist RNA do not colocalize. Note: The cell lines are tetraploid due to SV-40 transformation. (C) RNA FISH detecting Xist (FITC) and Cot-1 RNA (Cy3), followed by slide denaturation and X painting (FITC) in an XaXiΔXist clone. Arrows point to XiΔXist lying within a Cot-1 hole. (D) RNA FISH detecting Cot-1 RNA (Cy3, grayscale), followed by slide denaturation and DNA FISH with X (FITC) and Y (Cy3) painting probes. Representative cells from d0 male ES cells. Arrows, Cot-1 foci. Scale bar, 5 μm. (E) Patterns of Cot-1 pinpoint in d0 XY ES cells. n = 121. (F) RNA FISH detecting Cot-1 RNA (Cy3), followed by slide denaturation and DNA FISH with X painting probes (FITC). Representative cells from d0 female ES cells. Arrows, Cot-1 foci. (G) Pattern of Cot-1 RNA expression in d0 XX ES cells. n = 98.
F<sc>igure</sc> 3.—
Figure 3.—
Pol-II activity is not highly enriched at Cot-1 foci. RNA immuno-FISH of indicated cell lines to examine the sex-linked RNA (Cot-1, telomeric fraction, see Figure 5) and its relationship to Pol-II. Pol II (H5), elongating isoform; Pol II (CTD), C-terminal domain of Pol-II. Arrows indicate diffuse RNA clusters; asterisks denote speckled pattern. Day 0 ES cells are shown.
F<sc>igure</sc> 4.—
Figure 4.—
The sex-linked RNA foci are not of LINE and SINE origin. Two-color RNA FISH combines detection of the sex-linked RNA (Cot-1, telomeric fraction, see Figure 5) and repetitive elements of LINE L1 (A), SINE B1 (B), or SINE B2 (C) origin. Day 0 ES cells are shown. No overlap is seen.
F<sc>igure</sc> 5.—
Figure 5.—
The Cot-1 RNA is of telomeric origin. (A) Dual color RNA FISH on undenatured nuclei using a Cot-1 probe (Cy3) in combination with the telomeric RNA probe, (TAACCC)7-Alexa-488 (green). Scale bar, 5 μm. ES cells, d0. TelRNA, telomeric RNA. (B) RNA FISH with the complementary probe, (GGGTTA)6-Alexa-488. (C) The telomeric probe titrates away the Cot-1 pinpoint signal. Arrows, telomeric RNA foci. (D) DNA FISH on denatured nuclei with the (TAACCC)7-Alexa-488 probe shows the distribution of all telomeres. (E) Top: DNA FISH with distal telomeric probe (BAC RP23-461E16) and X paint on metaphase chromosome spread. Bottom: RNA FISH with telomeric RNA probe and BAC probe. The results show that the RNA foci are at the distal end of the Xs in d0 female ES cells. (F) Top: DNA FISH with proximal telomeric probe (BAC RP24-306P22) and X paint. Bottom: RNA FISH with telomeric RNA probe and BAC probe. The results show that the RNA foci are not at the proximal end of the Xs in d0 female ES cells. (G) Range of distances from telomeric RNA to indicated BAC markers. P < 0.001 calculated using the Student's t-test. Distances indicated in micrometers.
F<sc>igure</sc> 6.—
Figure 6.—
Transitional states of telomeric RNA in differentiating ES cells. (A) RNA FISH detecting telomeric RNA (Alexa-488, shown in grayscale) followed by DNA FISH using X (FITC) and Y (Cy3) chromosome paints in d4 male ES cells. Arrows, telomeric RNA. (B) Patterns of telomeric RNA expression in d4 male ES cells. (C) Patterns of telomeric RNA expression in d10 male ES cells. (D) A size difference in the telomeric RNA foci of male vs. female ES cells. Inset shows magnifications of the boxed signal. Scale bar, 1 μm. (E) RNA FISH detecting telomeric RNA followed by DNA FISH using X painting probes in d4 female ES cells. (F) Patterns of telomeric RNA expression in d4 female ES cells. (G) Patterns of telomeric RNA expression relative to Xist expression in d10 female ES cells.
F<sc>igure</sc> 7.—
Figure 7.—
Dcr deficiency leads to telomeric RNA upregulation. RNA FISH for telomeric RNA in d0 and d4 Dcr−/− and control Dcr+/− ES cells. Arrows, presumptive sex-linked telomeric RNA. Scale bar, 5 μm.
F<sc>igure</sc> 8.—
Figure 8.—
Northern analysis reveals a heterogeneous telomeric RNA population and possible small RNA species. (A) Northern analysis of telomeric RNA in d0, d4, and d11 ES cells and in primary mouse embryonic fibroblasts (MEF). Remaining levels of miR-292 in Dcr−/− cells are due to ≪5% residual Dcr activity in this line (Ogawa et al. 2008). (B) Northern analysis using increased starting material and blots that are trimmed to eliminate the highest molecular weight RNA species to visualize smaller species more effectively. The two images shown are different contrasts of the same blot. Arrows, 25-nt species.
F<sc>igure</sc> 9.—
Figure 9.—
Altered telomeric RNA patterns in physiologically aberrant states. (A) Telomeric RNA FISH in d0 Tsix−/− mouse ES cells. (B) Irradiation induces telomeric RNA upregulation in MEF cells. (C) Aberrant classes of hESC exhibit abnormal telomeric RNA expression. (D) Expression patterns of telomeric RNA in class I, II, and III hESC lines. (E) RNA FISH in the wild-type and human cancer cell lines indicated. Arrows, cells with single telomeric RNA pinpoint. Asterisks, cells with speckling. Unmarked cells have no detectable RNA foci.

Similar articles

Cited by

References

    1. Adewumi, O., B. Aflatoonian, L. Ahrlund-Richter, M. Amit, P. W. Andrews et al., 2007. Characterization of human embryonic stem cell lines by the International Stem Cell Initiative. Nat. Biotechnol. 25 803–816. - PubMed
    1. Azzalin, C. M., P. Reichenback, L. Khoriauli, E. Giulotto and J. Lingner, 2007. Telomeric repeat containing RNA and RNA surveillance factors at mammalian chromosome ends. Science 318 798–801. - PubMed
    1. Bacher, C. P., M. Guggiari, B. Brors, S. Augui, P. Clerc et al., 2006. Transient colocalization of X-inactivation centres accompanies the initiation of X inactivation. Nat. Cell Biol. 8 293–299. - PubMed
    1. Baur, J. A., Y. Zou, J. W. Shay and W. E. Wright, 2001. Telomere position effect in human cells. Science 292 2075–2077. - PubMed
    1. Birney, E., J. A. Stamatoyannopoulos, A. Dutta, R. Guigo, T. R. Gingeras et al., 2007. Identification and analysis of functional elements in 1% of the human genome by the ENCODE pilot project. Nature 447 799–816. - PMC - PubMed

Publication types

MeSH terms