. 2009 May;119(5):1189-200.
doi: 10.1172/JCI37284. Epub 2009 Apr 20.

Substance P stimulates human airway submucosal gland secretion mainly via a CFTR-dependent process

Affiliations

Substance P stimulates human airway submucosal gland secretion mainly via a CFTR-dependent process

Jae Young Choi et al. J Clin Invest. 2009 May.

Erratum in

  • J Clin Invest. 2010 Mar 1;120(3):931-2

Abstract

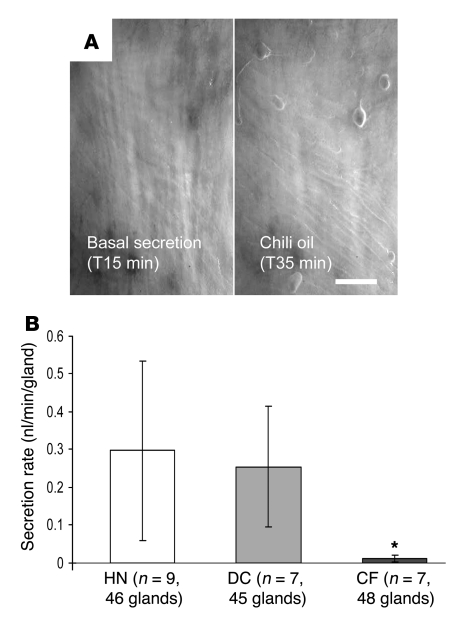
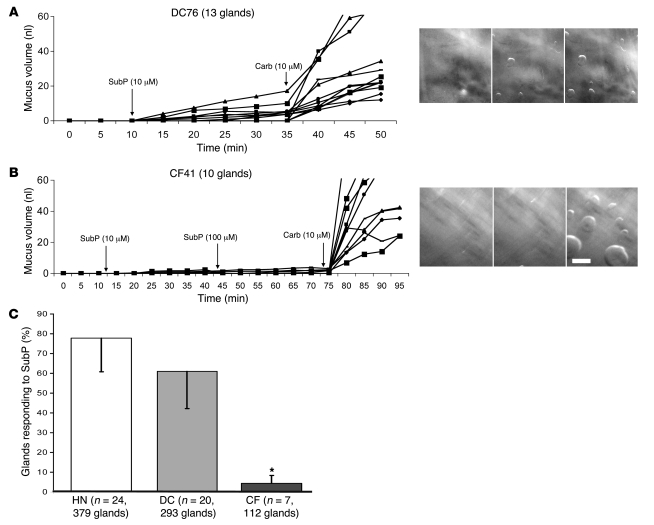
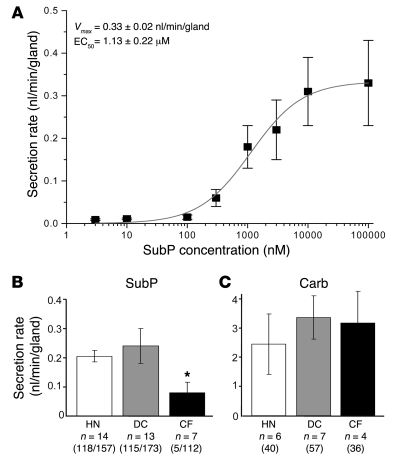
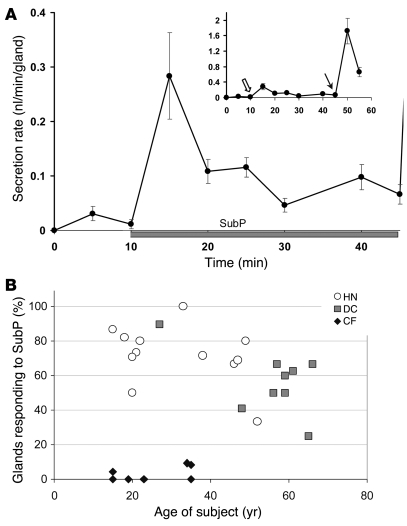
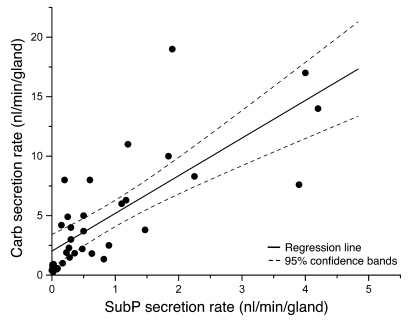
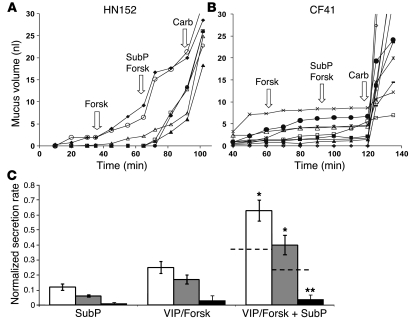
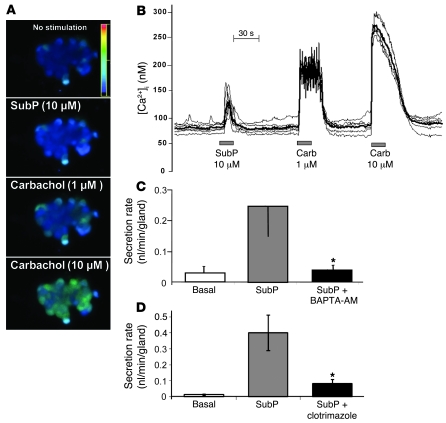
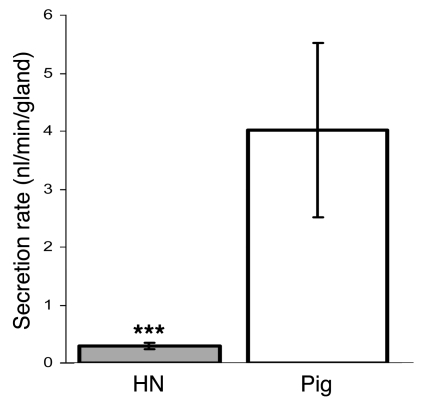
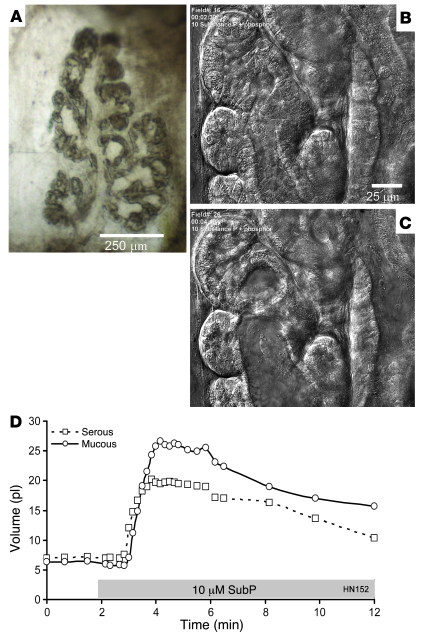
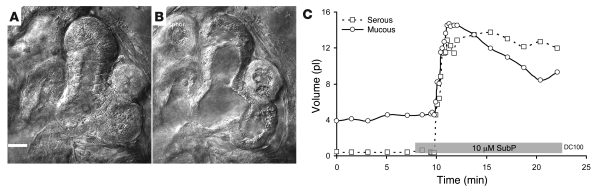
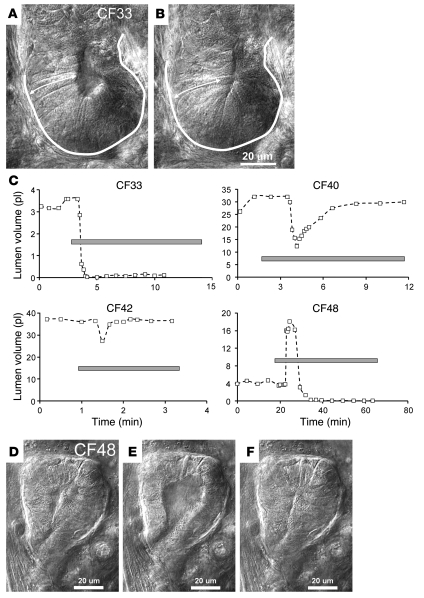
Chronic bacterial airway infections are the major cause of mortality in cystic fibrosis (CF). Normal airway defenses include reflex stimulation of submucosal gland mucus secretion by sensory neurons that release substance P (SubP). CFTR is an anion channel involved in fluid secretion and mutated in CF; the role of CFTR in secretions stimulated by SubP is unknown. We used optical methods to measure SubP-mediated secretion from human submucosal glands in lung transplant tissue. Glands from control but not CF subjects responded to mucosal chili oil. Similarly, serosal SubP stimulated secretion in more than 60% of control glands but only 4% of CF glands. Secretion triggered by SubP was synergistic with vasoactive intestinal peptide and/or forskolin but not with carbachol; synergy was absent in CF glands. Pig glands demonstrated a nearly 10-fold greater response to SubP. In 10 of 11 control glands isolated by fine dissection, SubP caused cell volume loss, lumen expansion, and mucus flow, but in 3 of 4 CF glands, it induced lumen narrowing. Thus, in CF, the reduced ability of mucosal irritants to stimulate airway gland secretion via SubP may be another factor that predisposes the airways to infections.


Figures

Figure 1
Figure 1. In human airways, mucosal chili oil stimulates submucosal gland mucus secretion from control (HN and DC) but not CF subjects.
(A) Images of mucus bubbles formed under oil at the orifices of single submucosal glands in response to stimulation via mucosal chili oil. At 15 minutes, 2 μl of chili oil was added to the approximately 20–30 μl oil layer. No mucus secretion was seen during the 15-minute control period (left panel); the right panel shows the results 20 minutes later. Scale bar: 0.5 mm. (B) Summary data showing average secretion rates (± SD) for 20-minute periods, following application of chili oil. If basal secretion was present in the control period, it was subtracted from the rates shown. The secretion rate for CF glands was less than control glands (*P < 0.05 versus HN + DC).
Figure 2
Figure 2. Serosal application of SubP-stimulated secretion from HN and DC but not CF airway glands.
(A and B) Plots of secreted mucus volume over time for individual glands from 1 DC and 1 CF subject after stimulation are shown (each line represents a single gland). Right panels show part of the fields at end of 20 minutes of basal, SubP, and carbachol (carb) stimulation, respectively. Scale bar: 0.5 mm. (C) SubP-stimulated secretion in a larger proportion of glands in HN or DC versus CF subjects. Each bar shows the mean percentage of viable glands that responded to SubP in HN, DC, and CF subjects. The total number of viable glands was defined as the number responding to 5 minutes of 10 μM carbachol at the end of the experiment. Error bars show SEM. CF response to SubP was significantly less than that of either HN or DC; *P < 0.05.
Figure 3
Figure 3. Secretion rates of human airway glands to SubP.
(A) Approximate dose-response relationship for submucosal gland secretion from HN glands. Each point is the average of 10–14 glands from 2–3 different HN subjects; 5 HN subjects were used for the graph, and all data were obtained within 8 hours of harvest. The secretion rate was averaged over the first 15 minutes following SubP addition. Up to 3 increasing concentrations were administered per subject. (B and C) Summary data for average secretion rates measured 15 minutes after 10 μM SubP and 5–10 minutes after 10 μM carbachol. The scale for responses to carbachol is 10 times the scale for responses to SubP. Bars in B show the secretion rate for responding glands and are labeled with the number of subjects, number of responding glands, and total number of glands tested. Five CF glands responded to SubP of more than 100 tested. The CF secretory rate for the 5 responding glands was significantly less than that for either HN or DC glands. *P < 0.05. Bars in C show the secretion rate for responding glands and are labeled with the number of subjects and total number of glands tested. Error bars are SEM (AC).
Figure 4
Figure 4. Typical gland response to SubP.
(A) The time course of secretion rate to SubP shows an early peak like the response to carbachol. The graph shows (mean ± SEM) secretion rates averaged over 5-minute periods for 15 glands from 3 HN subjects tested 6–9 hours from harvest; 10 μM SubP plus 1 μM phosphoramidon was added at 10 minutes. The inset is rescaled to show, in these same glands, both the response to SubP (open arrow) and the subsequent response to 10 μM carbachol, added at the 45-minute time point (arrow). (B) Age- and disease-related changes in responses of human airway glands to SubP in HN, DC, and CF subjects. Each symbol shows the percentage of glands that responded to SubP as a function of type and age of subject. Data are for a subset of subjects, in which counts were made of total glands responding to carbachol.
Figure 5
Figure 5. Secretion rate to SubP is positively correlated to secretion rate to carbachol.
Each point shows the peak single gland secretion rates to carbachol and SubP from 21 glands from 4 HN subjects and 13 glands from 3 DC subjects. One symbol is used for both groups, because their rates did not differ. SubP stimulation preceded carbachol. Of 110 glands, 18 (16%) responded only to carbachol; the mean peak secretion rate of those glands was 1.26 ± 0.18 nl/min/gland. The solid line shows linear regression (r = 0.76, P < 0.0001).
Figure 6
Figure 6. Stimulation of secretion by SubP is synergistic with forskolin or VIP in HN and DC but not CF glands.
(A) Secretion from individual HN glands to 10 μM forskolin (forsk), 10 μM SubP plus forskolin, and finally 10 μM carbachol. (B) The same sequence in a CF subject except for a 1-hour interval of basal secretion (data not shown). (C) Summary showing synergism in control subjects for saturating concentrations of SubP (averaged over 15 minutes), with saturating concentrations of either forskolin or VIP (averaged over 20–30 minutes). Responses were normalized to the peak secretory rates of those same glands to 10 μM carbachol given at the end of the experiment. Responses to forskolin plus SubP in HN (white bars) or DC (gray bars) subjects were greater than the summed responses of the agents given separately (indicated by the dashed lines; *P < 0.05). In contrast, CF glands (black bars) showed minimal responses to either agent alone or in combination; (**P < 0.01 versus control groups). Experiments were based on 20–45 glands from 4 HN, 6 DC, and 3 CF subjects. Error bars are SEM.
Figure 7
Figure 7. Evidence that SubP stimulates gland secretion, in part, via elevating [Ca2+]i.
(A) Fluorescence changes in response to 10 μM SubP and 1 or 10 μM carbachol. Cell diameters in images are approximately 20 microns. (B) [Ca2+]i versus time for 6 cells from images in A, measured in response to sequential pulses of 10 μM SubP and 1 and 10 μM carbachol. Fluorescence ratio, 340 nm/380 nm. (C) Mean response to SubP in presence or absence of BAPTA-AM (500 μM); 4 experiments from 2 HN and 1 DC subjects (16–20 glands). Error bars are SEM. (D) Mean response to SubP in the absence and presence of clotrimazole (25 μM), which blocks Ca2+-activated K+ channels (n = 4, 27–42 glands). *P < 0.05 versus SubP responses. Error bars are SEM.
Figure 8
Figure 8. SubP stimulates airway gland secretion more strongly in pigs than in humans.
A graph of (mean ± SEM) single gland secretion rates for 15 minutes after 10 μM SubP application is shown (n = 3 pigs, 28 glands; n = 8 humans, 60 glands). Time from harvest to testing was 4 ± 2 hours for pigs and 6 ± 2 hours for humans. ***P < 0.001.
Figure 9
Figure 9. Isolated HN gland exposed to SubP shows cell shrinkage, lumen volume expansion, and fluid secretion when monitored with DIC.
(A) One lobe of an isolated human gland. Scale bar: 250 μm. (B) Serous acini and mucous tubules just prior to stimulation. (C) Same gland structures 100 seconds after addition of 10 μM SubP plus 1 μM phosphoramidon. Scale bar: 25 μm (B and C). (D) Plots of volumes of serous and mucous lumens as a function of time and stimulation (indicated with gray bar; see Methods).
Figure 10
Figure 10. Isolated DC gland exposed to SubP shows cell shrinkage, lumen volume expansion, and fluid secretion when monitored with DIC.
The gland is from a subject with COPD. (A) Serous acini and mucus tubules just prior to stimulation. (B) The same structures at peak of response to 10 μM SubP plus 1 μM phosphoramidon (phosphor). Scale bar: 20 μm (A and B). (C) Plots of volumes of serous and mucous lumens as a function of time and stimulation (indicated with gray bar; see Methods).
Figure 11
Figure 11. Aberrant responses in CF gland acini to SubP.
(A) Acinus and tubule just prior to stimulation. (B) Same structures at peak response to 10 μM SubP plus 1 μM phosphoramidon. The acinus was outlined and an arrow was drawn spanning cell height in the control state, and these were then copied onto the image of the acinus at peak stimulation to show changes. (C) Plots of lumen volumes assuming them to be cylinders (see Methods) for 4 CF subjects stimulated with SubP. A decrease in lumen volume was observed in 3 of 4 CF subjects stimulated with SubP; these subjects did not secrete mucus when assayed with oil layer method. CF48 responded with a normal increase in lumen volume but with a much shorter time course than controls. The gray bar indicates the period of SubP stimulation. (DF) Lumen expansion of CF48. Images are just before (D), at peak (E), and at minimal lumen volume (F) (which was maintained in this gland) in response to 10 μM SubP plus 1 μM phosphoramidon and 10 μM atropine. Scale bar: 20 μm.

Similar articles

Cited by

References

    1. Engelhardt J.F., et al. Submucosal glands are the predominant site of CFTR expression in the human bronchus. Nat. Genet. 1992;2:240–248. doi: 10.1038/ng1192-240. - DOI - PubMed
    1. Engelhardt J.F., Zepeda M., Cohn J.A., Yankaskas J.R., Wilson J.M. Expression of the cystic fibrosis gene in adult human lung. J. Clin. Invest. 1994;93:737–749. doi: 10.1172/JCI117028. - DOI - PMC - PubMed
    1. Kreda S.M., et al. Characterization of wild-type and deltaF508 cystic fibrosis transmembrane regulator in human respiratory epithelia. Mol. Biol. Cell. 2005;16:2154–2167. doi: 10.1091/mbc.E04-11-1010. - DOI - PMC - PubMed
    1. Wu J.V., Krouse M., Wine J.J. Acinar origin of CFTR-dependent airway submucosal gland fluid secretion. Am. J. Physiol. Lung Cell Mol. Physiol. 2007;292:L304–L311. doi: 10.1152/ajplung.00286.2006. - DOI - PubMed
    1. Wine J.J., Joo N.S. Submucosal glands and airway defense. Proc. Am. Thorac. Soc. 2004;1:47–53. doi: 10.1513/pats.2306015. - DOI - PubMed

Publication types

MeSH terms