. 2009 May;119(5):1286-97.
doi: 10.1172/JCI38399. Epub 2009 Apr 20.

Kidney dendritic cell activation is required for progression of renal disease in a mouse model of glomerular injury

Affiliations

Kidney dendritic cell activation is required for progression of renal disease in a mouse model of glomerular injury

Felix Heymann et al. J Clin Invest. 2009 May.

Erratum in

  • J Clin Invest. 2009 Jul;119(7):2114

Abstract

The progression of kidney disease to renal failure correlates with infiltration of mononuclear immune cells into the tubulointerstitium. These infiltrates contain macrophages, DCs, and T cells, but the role of each cell type in disease progression is unclear. To investigate the underlying immune mechanisms, we generated transgenic mice that selectively expressed the model antigens ovalbumin and hen egg lysozyme in glomerular podocytes (NOH mice). Coinjection of ovalbumin-specific transgenic CD8+ CTLs and CD4+ Th cells into NOH mice resulted in periglomerular mononuclear infiltrates and inflammation of parietal epithelial cells, similar to lesions frequently observed in human chronic glomerulonephritis. Repetitive T cell injections aggravated infiltration and caused progression to structural and functional kidney damage after 4 weeks. Mechanistic analysis revealed that DCs in renal lymph nodes constitutively cross-presented ovalbumin and activated CTLs. These CTLs released further ovalbumin for CTL activation in the lymph nodes and for simultaneous presentation to Th cells by distinct DC subsets residing in the kidney tubulointerstitium. Crosstalk between tubulointerstitial DCs and Th cells resulted in intrarenal cytokine and chemokine production and in recruitment of more CTLs, monocyte-derived DCs, and macrophages. The importance of DCs was established by the fact that DC depletion rapidly resolved established kidney immunopathology. These findings demonstrate that glomerular antigen-specific CTLs and Th cells can jointly induce renal immunopathology and identify kidney DCs as a mechanistic link between glomerular injury and the progression of kidney disease.


Figures

Figure 1
Figure 1. Generation and characterization of mice expressing model autoantigens in glomeruli.
(A) Plasmid used to generate NOH mice. (B) Kidney sections of a NOH (left) and non-Tg control (right) mouse stained for OVA expression. Red, OVA; blue, nuclei. Original magnification, ×1,000. (C) Division indices of CFSE-labeled OT-I cells in various LNs and the spleen of NOH and non-Tg mice on day 3 after adoptive transfer. (D) CFSE-labeled OT-I cells were injected into NOH × CD11c-DTR, NOH, or non-Tg mice, and DCs were depleted by injection of DT on the same day. Bars indicate division indices of OT-I cells in the renal LN on day 3. nOT-I, naive OT-I. (E) CD69 expression of CFSE-labeled OT-II cells in the renal LN of NOH and non-Tg mice on day 3 after transfer. In vitro–activated OT-II cells were used as positive staining control. Representative flow cytometry data for C and D appear in Supplemental Figure 2. Results are representative of 3 experiments in groups of 3 mice. Data are presented as mean ± SD. aOT-II, activated OT-II cells.
Figure 2
Figure 2. Glomerular antigen–specific CTLs release antigen for cross-presentation in the renal LN.
5 × 10⁶ activated OT-I cells were injected into NOH or WT mice. After 2 days, 2 × 10⁶ CFSE-labeled OT-I cells were injected, and their proliferative response (A) and CD69 expression (B) were determined in the renal LNs. (C) Maturation state of renal LN DCs of NOH (black bars) and WT mice (white bars) injected with activated OT-I cells was determined by measuring CD86 and CD40 on CD11c+ cells. Representative flow cytometry data appear in Supplemental Figure 4. Results are representative of 3 experiments in groups of 3 mice. *P < 0.05; **P < 0.01. MFI, mean fluorescence intensity.
Figure 3
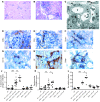
Figure 3. Histological analysis of periglomerular infiltrates in NOH mice.
(AC) PAS staining (A and B) or electron microscopy analysis (C) of kidney sections of NOH mice injected with 5 × 10⁶ OT-I cells and 5 × 10⁶ activated OT-II cells 7 days before analysis. Note in C multiple contacts of podocytes with parietal epithelia separated by a very thin membrane from the periglomerular infiltrate. C, capillary; E, erythrocyte; M, mesangium; MnC, mononuclear cell; P, podocyte; PE, parietal epithelium; pgs, periglomerular space; asterisk, capsule membrane. Original magnification, ×3,000. Scale bar: 10 μm. (DI) Representative immunohistochemistry for expression of CD8 (D), CD4 (E), CD11c (F), CD11b (G), MHC II (I-Ab) (H), and CD86 (I). (J) The frequency of glomeruli surrounded by mononuclear infiltrates was determined in HE-stained kidney sections of NOH or non-Tg mice injected with OT-I and/or activated OT-II cells as indicated. Shown are data from a group of mice that repetitively received T cell injections on days 7, 14, and 21. That group was analyzed on day 28 (histology in Figure 8). (K) Affected glomeruli were scored for the severity of periglomerular infiltrates. Results are representative of 4 experiments in groups of 3–5 mice. (L) Quantitative analysis of 2 of these experiments, an example of which was given in Supplemental Figure 7. In JL, symbols indicate results from individual mice and the bars their mean. *P < 0.05; **P < 0.01; ***P < 0.001.
Figure 4
Figure 4. DC subsets in infiltrated kidneys.
(A) MHC II+ cells in kidney single-cell suspensions from NOH (lower dot plot) or non-Tg (upper dot plot) mice injected with 5 × 10⁶ OT-I cells and 5 × 10⁶ activated OT-II cells were analyzed for expression of CD11b versus CD11c. (B) Absolute numbers of CD11c+CD11bint DCs, CD11c+CD11bhi DCs, CD11cCD11blo macrophages, CD11c+CD11bhi Gr1+ DCs, and CD11cCD11blo Gr1+ macrophages in groups of 4 OT-I/II-injected NOH (black bars) or non-Tg (white bars) mice. (C) Dot plots shown as in A except that Gr1 was given instead of CD11c (left 2 dot plots). The right 2 dot plots show expression of CD11c versus Gr1 on the CD11bhi cells represented in A. Numbers in quadrants of dot plots indicate the proportion of cells. Results are representative of 3 experiments. **P < 0.01; ***P < 0.001. Data are presented as mean ± SD.
Figure 5
Figure 5. DCs are essential for periglomerular infiltration.
(A) 4 ng/g body weight DT was injected into WT, NOH, or NOH × CD11c-DTR mice that had received 5 × 10⁶ OT-I cells and 5 × 10⁶ activated OT-II cells 5 days before. After an additional 40 hours, kidney single-cell suspensions were examined for surviving DCs by flow cytometry for CD11c+ and eGFP expression within the transgene. Dot plots show representative results, and a quantitative analysis is given in the same panel to the right. Numbers in quadrants of dot plots indicate the proportion of cells. (BG) 5 × 10⁶ OT-I cells and 5 × 10⁶ activated OT-II cells were injected into NOH × CD11c-DTR (B and C) or NOH mice (D and E). After 5 days, DT was injected (B and C). Kidney sections were scored after 40 hours for frequency (F) and severity (G) of infiltrates. Representative H&E stainings are shown in BE. Scale bars: 400 μm. Semiquantitative analyses show 2 further controls: non-Tg mice injected with DT and NOH mice not injected with DT. Symbols indicate sections from individual mice and the bars their mean. Results are representative of 2 experiments. *P < 0.05; **P < 0.01; ***P < 0.001. Data are presented as mean ± SD.
Figure 6
Figure 6. Kidney DCs present CTL-released glomerular antigen to OT-II cells.
(AC) DC maturation markers CD86 (A) and CD40 (B) and intracellular IL-12 production (C) were determined on CD11c+MHC II+ kidney DCs on day 3 after injection of 5 × 10⁶ activated OT-I cells and/or 5 × 10⁶ activated OT-II cells as indicated. OT-I cells were used here also in an activated state to synchronize their effector phase with that of activated OT-II cells. Numbers in quadrants of dot plots indicate the proportion of cells. (D) NOH and non-Tg mice were injected with activated OT-I cells (+aOT-I) or not (–aOT-I). After 3 days, CD11c+ DCs were isolated from the kidney and spleen. 5 × 10⁶ DCs were cultured with 5 × 10⁶ OT-II cells. After 2 days, IFN-γ concentrations in the supernatant were determined by ELISA. Results are representative of 2 experiments. *P < 0.05; **P < 0.01; ***P < 0.001. Data are presented as mean ± SD.
Figure 7
Figure 7. Interaction between kidney DCs and Th cells causes intrarenal CTL accumulation.
NOH (black bars) or non-Tg (white bars) mice were injected with 5 × 10⁶ OT-I cells alone or together with 5 × 10⁶ activated OT-II cells. (AC) After 7 days, single-cell suspensions of the kidney (A and B) or the spleen (C) were analyzed by flow cytometry to determine numbers of CD8+Vα2+Vβ5+ OT-I (A and C) or proportions of (B) IFN-γ–producing OT-I cells. (D) Numbers of CD4+ Vα2+Vβ5+ OT-II cells were determined after injection of 5 × 10⁶ OT-II cells alone or together with 5 × 10⁶ activated OT-II cells. (E) Experiments depicted in AC show determination of Ki-67+ OT-I cells. In vitro–activated OT-II cells served as positive control, naive OT-II cells as negative control for proliferating cells. (F and G) Vα2+Vβ5+CD4+ OT-II (F) or Vα2+Vβ5+CD8+ OT-I cells (G) were sorted from kidney cell suspensions of experiments depicted in AC. mRNA encoding CCL3, CCL4, CCL5, and CCR5 was determined, and the ratio between cells from NOH and non-Tg controls was displayed. (H) Mononuclear cell infiltrates and noninfiltrated tubulointerstitial control areas were excised from kidney cryosections as shown in Supplemental Figure 8. mRNA encoding CCL3, CCL4, CCL5, and CCR5 was determined, and the ratio between infiltrates from injected NOH and non-Tg controls was displayed. Results are representative of 2 experiments. *P < 0.05; **P < 0.01; ***P < 0.001. Data are presented as mean ± SD.
Figure 8
Figure 8. Repetitive OT cell injection causes functional and structural kidney damage in NOH mice.
NOH mice were injected with 5 × 10⁶ OT-I cells and with 5 × 10⁶ activated OT-II cells on days 0, 7, 14, and 21. On day 7 (C and E) or day 28 (A, B, D, and FI), kidneys were taken for PAS staining (A and B), type IV collagen staining for fibrotic areas (C and D), OVA staining (E and F; black arrows indicate OVA+ cells in Bowman capsule wall), and electron microscopy (G). White arrow, contact between podocytes and parietal cells; black arrow, podocyte foot processes. Original magnification, ×3,000. Scale bar: 10 μm. (H) Daily excretion of albumin (g/l) per creatinine (g/l) was determined in overnight urine of groups of NOH or non-Tg mice injected with nOT-I and/or activated OT-II cells. (I) 20 μl urine from mice in groups denoted by diamonds and open squares on day 7 were separated by gel electrophoresis and stained with Coomassie blue. Results are representative of 2 experiments.*P < 0.05; **P < 0.01; ***P < 0.001.

Comment in

Similar articles

Cited by

References

    1. Bohle A., Strutz F., Muller G.A. On the pathogenesis of chronic renal failure in primary glomerulopathies: a view from the interstitium. Exp. Nephrol. 1994;2:205–210. - PubMed
    1. Nikolic-Paterson D.J., Atkins R.C. The role of macrophages in glomerulonephritis. Nephrol. Dial. Transplant. 2001;16(Suppl. 5):3–7. - PubMed
    1. Kriz W., LeHir M. Pathways to nephron loss starting from glomerular diseases-insights from animal models. Kidney Int. 2005;67:404–419. doi: 10.1111/j.1523-1755.2005.67097.x. - DOI - PubMed
    1. Abbate M., Zoja C., Remuzzi G. How does proteinuria cause progressive renal damage? J. Am. Soc. Nephrol. 2006;17:2974–2984. doi: 10.1681/ASN.2006040377. - DOI - PubMed
    1. Markovic-Lipkovski J., Muller C.A., Risler T., Bohle A., Muller G.A. Association of glomerular and interstitial mononuclear leukocytes with different forms of glomerulonephritis. Nephrol. Dial. Transplant. 1990;5:10–17. - PubMed

Publication types

MeSH terms