

Diagnosing schistosomiasis by detection of cell-free parasite DNA in human plasma
- PMID: 19381285
- PMCID: PMC2667260
- DOI: 10.1371/journal.pntd.0000422
Diagnosing schistosomiasis by detection of cell-free parasite DNA in human plasma
Abstract
Introduction: Schistosomiasis (bilharzia), one of the most relevant parasitoses of humans, is confirmed by microscopic detection of eggs in stool, urine, or organ biopsies. The sensitivity of these procedures is variable due to fluctuation of egg shedding. Serological tests on the other hand do not distinguish between active and past disease. In patients with acute disease (Katayama syndrome), both serology and direct detection may produce false negative results. To overcome these obstacles, we developed a novel diagnostic strategy, following the rationale that Schistosoma DNA may be liberated as a result of parasite turnover and reach the blood. Cell-free parasite DNA (CFPD) was detected in plasma by PCR.
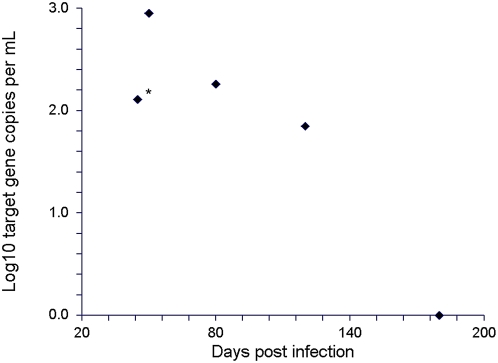
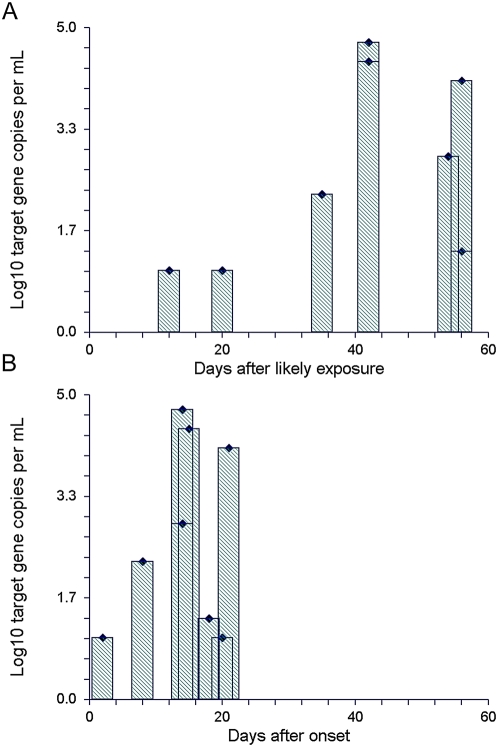
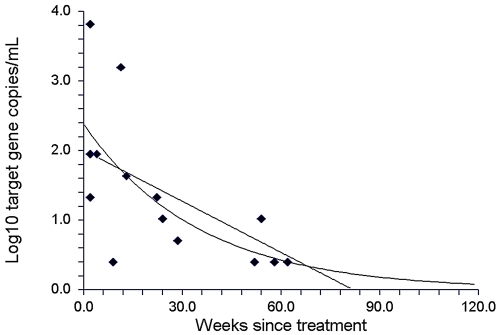
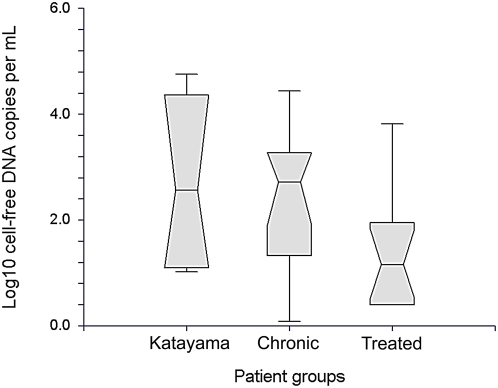
Methodology/principal findings: Real-time PCR with internal control was developed and optimized for detection of CFPD in human plasma. Distribution was studied in a mouse model for Schistosoma replication and elimination, as well as in human patients seen before and after treatment. CFPD was detectable in mouse plasma, and its concentration correlated with the course of anti-Schistosoma treatment. Humans with chronic disease and eggs in stool or urine (n = 14) showed a 100% rate of CFPD detection. CFPD was also detected in all (n = 8) patients with Katayama syndrome. Patients in whom no viable eggs could be detected and who had been treated for schistomiasis in the past (n = 30) showed lower detection rates (33.3%) and significantly lower CFPD concentrations. The duration from treatment to total elimination of CFPD from plasma was projected to exceed one year.
Conclusions/significance: PCR for detection of CFPD in human plasma may provide a new laboratory tool for diagnosing schistosomiasis in all phases of clinical disease, including the capacity to rule out Katayama syndrome and active disease. Further studies are needed to confirm the clinical usefulness of CFPD quantification in therapy monitoring.
Conflict of interest statement
The authors have declared that no competing interests exist.
Figures
References
-
- King CH, Dickman K, Tisch DJ. Reassessment of the cost of chronic helmintic infection: a meta-analysis of disability-related outcomes in endemic schistosomiasis. Lancet. 2005;365:1561–1569. - PubMed
-
- Chitsulo L, Loverde P, Engels D. Schistosomiasis. Nat Rev Microbiol. 2004;2:12–13. - PubMed
-
- Patz JA, Graczyk TK, Geller N, Vittor AY. Effects of environmental change on emerging parasitic diseases. Int J Parasitol. 2000;30:1395–1405. - PubMed
-
- Ross AG, Bartley PB, Sleigh AC, Olds GR, Li Y, et al. Schistosomiasis. N Engl J Med. 2002;346:1212–1220. - PubMed
-
- Gryseels B, Polman K, Clerinx J, Kestens L. Human schistosomiasis. Lancet. 2006;368:1106–1118. - PubMed
Publication types
MeSH terms
Substances
LinkOut - more resources
Full Text Sources
Other Literature Sources
Miscellaneous
