. 2009;4(4):e5226.
doi: 10.1371/journal.pone.0005226. Epub 2009 Apr 21.

Uncovering intrinsic modular organization of spontaneous brain activity in humans

Affiliations

Uncovering intrinsic modular organization of spontaneous brain activity in humans

Yong He et al. PLoS One. 2009.

Abstract

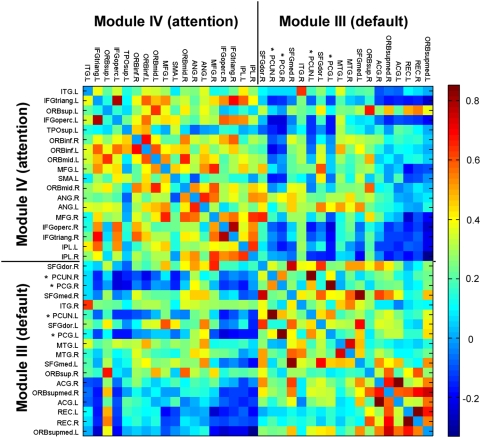
The characterization of topological architecture of complex brain networks is one of the most challenging issues in neuroscience. Slow (<0.1 Hz), spontaneous fluctuations of the blood oxygen level dependent (BOLD) signal in functional magnetic resonance imaging are thought to be potentially important for the reflection of spontaneous neuronal activity. Many studies have shown that these fluctuations are highly coherent within anatomically or functionally linked areas of the brain. However, the underlying topological mechanisms responsible for these coherent intrinsic or spontaneous fluctuations are still poorly understood. Here, we apply modern network analysis techniques to investigate how spontaneous neuronal activities in the human brain derived from the resting-state BOLD signals are topologically organized at both the temporal and spatial scales. We first show that the spontaneous brain functional networks have an intrinsically cohesive modular structure in which the connections between regions are much denser within modules than between them. These identified modules are found to be closely associated with several well known functionally interconnected subsystems such as the somatosensory/motor, auditory, attention, visual, subcortical, and the "default" system. Specifically, we demonstrate that the module-specific topological features can not be captured by means of computing the corresponding global network parameters, suggesting a unique organization within each module. Finally, we identify several pivotal network connectors and paths (predominantly associated with the association and limbic/paralimbic cortex regions) that are vital for the global coordination of information flow over the whole network, and we find that their lesions (deletions) critically affect the stability and robustness of the brain functional system. Together, our results demonstrate the highly organized modular architecture and associated topological properties in the temporal and spatial brain functional networks of the human brain that underlie spontaneous neuronal dynamics, which provides important implications for our understanding of how intrinsically coherent spontaneous brain activity has evolved into an optimal neuronal architecture to support global computation and information integration in the absence of specific stimuli or behaviors.


Conflict of interest statement

Competing Interests: The authors have declared that no competing interests exist.

Figures

Figure 1
Figure 1. Inter-regional correlation matrix and its functional connectivity backbone.
(A) The mean correlation matrix is obtained by averaging a set of correlation matrices across subjects where individual correlation matrix is acquired by calculating Pearson correlation coefficients of time series between every pair of brain regions. The color bar indicates the correlation coefficients. The black arrow in the color bar indicates the threshold value (r = 0.44) that was used to obtain the binarized matrix (B). For the abbreviations of the regions, see Table S1. (B) The functional connectivity backbone (binarized matrix) is obtained by thresholding the mean correlation matrix using a Bonforroni-corrected procedure (P<0.001). Significant correlations between regions are marked in white squares and black squares otherwise. Notably, the binarized matrix describes the basic topological organization of the spontaneous human brain functional network.
Figure 2
Figure 2. The modular architecture of the human brain functional network.
We identify five functional modules in the spontaneous brain functional network represented by five different colors. The geometric distance between two brain regions on the drawing space approximates the shortest path length between them. The network is visualized with the Pajek software package (http://vlado.fmf.uni-lj.si/pub/networks/pajek/) using a Kamada-Kawai layout algorithm. The intra-module and inter-module connections are shown in gray and dark lines, respectively. For the abbreviations of the regions, see Table S1.
Figure 3
Figure 3. Surface and anatomical representation of modular architecture of the human brain functional network.
(A) All of 90 brain regions are marked by using different colored spheres (different colors represent distinct network modules) and further mapped onto the cortical surfaces at the lateral, medial and top views, respectively, by using the Caret software . Notably, the regions are located according to their centroid stereotaxic coordinates. For the visualization purpose, the subcortical regions are projected to the medial cortical surface according to their y and z centroid stereotaxic coordinates. (B) Sagittal and top views of the spontaneous brain functional network. The nodes and edges within each module are marked in one single color. The inter-module connections are shown in gray lines. For the abbreviations of the regions, see Table S1.
Figure 4
Figure 4. The anti-correlation map between module III and module IV.
We show the inter-regional correlations between module III and module IV. The two key regions in the ‘default’ subnetwork (module III), the posterior cingulate cortex and precuneus (asterisk signs), exhibit dramatically negative correlations with most of brain regions in the attention subnetwork (module IV). The color bar indicates the correlation coefficients. Note that the correlation matrix is extracted from Figure 1A.
Figure 5
Figure 5. The global hubs with high topological centralities in the human brain functional networks.
(A) The surface visualization of all 90 brain regions with node sizes indicating their relative node betweenness centrality, Nbc values. Regions with Nbc>mean+std are considered as hubs (red colors) and non-hubs (blue colors) otherwise. (Figure 1B). (B) The bar plot of all 90 brain regions in a descending order of their relative node betweenness centrality. Red and blue color bars indicate hub regions and non-hub regions in the brain network, respectively. For the abbreviations of the regions, see Table S1. (C) The bar plot of the occurrence that brain regions show high Nbc values (>mean) in the functional brain networks constructed at all selected statistical thresholds (P = 0.001, 0.005, 0.01, 0.05 and 0.10). If one region shows a high occurrence, it indicates that this region has a high topological centrality in the spontaneous brain functional networks and is insensitive to the selection of statistical thresholds.
Figure 6
Figure 6. Topological distribution of the human brain functional networks.
(A) Log-log plot of the cumulative probability of node degree distribution. (B) Log-log plot of the cumulative probability of relative node betweenness distribution. (C) Log-log plot of the cumulative probability of relative edge betweenness distribution. The solid, dashed and dotted lines indicate the fits of exponentially truncated power law [p(x)∼xα−1ex/xc], exponential [p(x)∼ex/xc], and power law [p(x)∼xα−1], respectively. R-squared values indicate the goodness of the fits. Retp, R-squared value for an exponentially truncated power law fit; Re, R-squared value for an exponential fit; and Rp, R-squared value for a power law fit.
Figure 7
Figure 7. The classifications of brain regions by means of their intra- and inter-module connectivity patterns.
All of 90 brain regions are divided into four categories in terms of their relative regional within-module betweenness centrality (Nbcs) and participant coefficient (PC) (see Materials and Methods). The bars denote the ranked Nbcs values within modules. The identified global hubs in the brain functional networks are marked in red colors and are found to be mainly composed of the network connectors. For the abbreviations of the regions, see Table S1.
Figure 8
Figure 8. Surface representation of the network connectors.
(A) The surface visualization of all 90 brain regions with node sizes indicating their participant coefficient (PC) values. Regions with PC>0.30 are considered connectors (red and yellow colors) and otherwise non-connectors (blue colors). (B) The bar plot of all 90 brain regions in a descending order of their PC values. Red, yellow and blue color bars indicate the connector hubs, connector non-hubs, and non-connectors in the brain network, respectively. For the abbreviations of the regions, see Table S1. (C) The bar plot of the occurrence that brain regions show high PC values (>0.30) in the functional brain networks constructed at all selected statistical thresholds (P = 0.001, 0.005, 0.01, 0.05 and 0.10). If one region shows a high occurrence, it indicates that this region has a high participant coefficient in the spontaneous brain functional networks and is insensitive to the selection of statistical thresholds.
Figure 9
Figure 9. Topological robustness of the human brain functional network.
(A) Network robustness in response to node (brain regions) lesions. The graphs show the changes in the relative characteristic path length (left) and the size of the largest connected component (right) as a function of the fraction of removed nodes. The removal of R1 connector hubs is omitted because only 3 nodes are included in the brain networks. (B) Network robustness in response to edge (connections) lesions. The graphs show the changes in the relative characteristic path length (left) and the size of the largest connected component (right) as a function of the fraction of removed edges.
Figure 10
Figure 10. Reproducibility assessment of our results.
(A) The two correlation matrices are separately shown (left: dataset 1; right: dataset 2). The right graph shows the correlation (r = 0.90) between dataset 1 and dataset 2. The results show that there is a high similarity in correlation patterns between dataset 1 and dataset 2. (B) The modular structures of brain functional networks are separately shown (left: dataset 1; right: dataset 2). There is also a high similarity between dataset 1 and dataset 2.

References

    1. Fox MD, Raichle ME. Spontaneous fluctuations in brain activity observed with functional magnetic resonance imaging. Nat Rev Neurosci. 2007;8:700–711. - PubMed
    1. Raichle ME. Neuroscience. The brain's dark energy. Science. 2006;314:1249–1250. - PubMed
    1. Raichle ME, Mintun MA. Brain work and brain imaging. Annu Rev Neurosci. 2006;29:449–476. - PubMed
    1. Zang Y, Jiang T, Lu Y, He Y, Tian L. Regional homogeneity approach to fMRI data analysis. Neuroimage. 2004;22:394–400. - PubMed
    1. He Y, Wang L, Zang Y, Tian L, Zhang X, et al. Regional coherence changes in the early stages of Alzheimer's disease: a combined structural and resting-state functional MRI study. Neuroimage. 2007;35:488–500. - PubMed

Publication types