

Molecular evidence of senescence in corneal endothelial cells of senescence-accelerated mice
- PMID: 19381346
- PMCID: PMC2669445
Molecular evidence of senescence in corneal endothelial cells of senescence-accelerated mice
Abstract
Purpose: To investigate senescent evidence in corneal endothelial cells (CECs) of the senescence-accelerated mouse (SAM), which is considered a suitable animal model for the further study of the senescent mechanism in CECs.
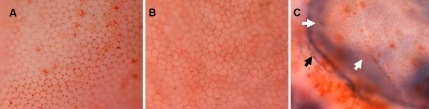
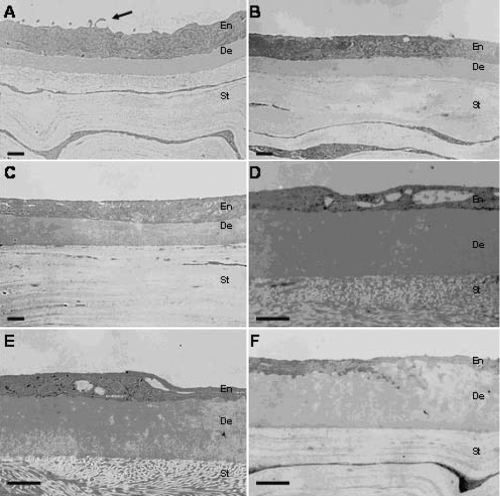
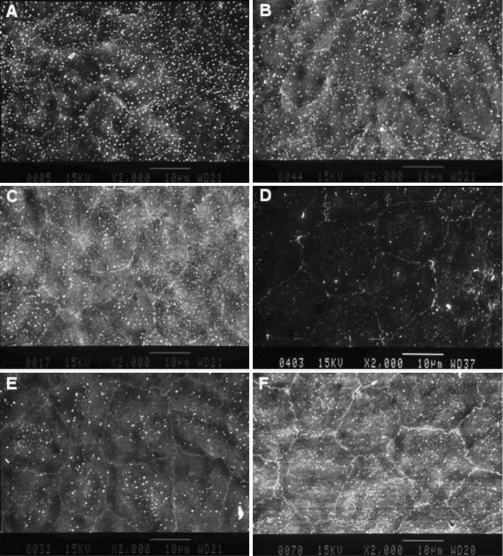
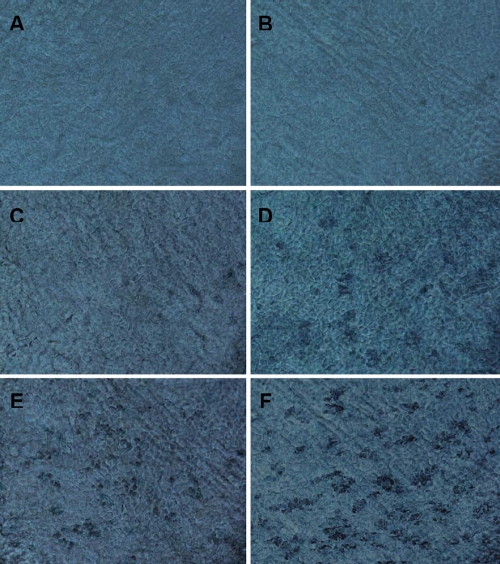
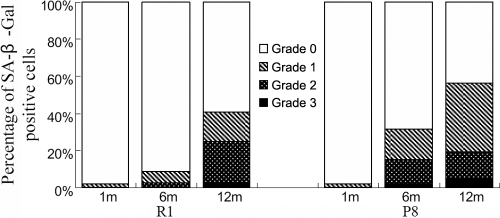
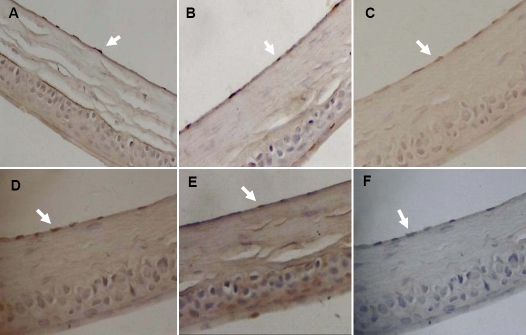
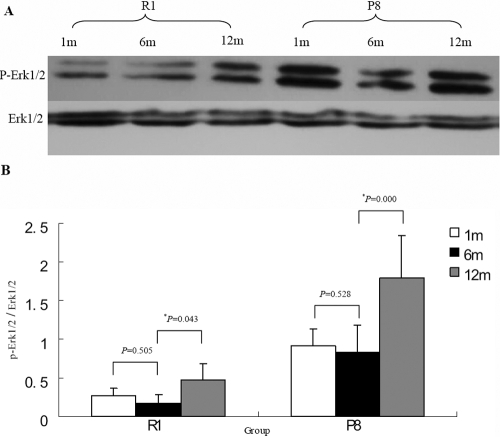
Methods: Thirty-six male mice from a senescence resistant mouse strain (SAM R1) and a senescence-prone strain (SAM P8) at various ages (1, 6, and 12 months) were analyzed in this study. The endothelial cell density (ECD) and cell viability were detected using trypan blue and alizarin red dyes while the senescent cells were observed by senescence-associated beta-galactosidase (SA-beta-Gal; pH 6.0) staining. In addition, ultrastructure was observed using an electron microscope. The senescence-related genes (p16(INK4a), p19(ARF), p21(WAF1/CIP1), and p53) in the CECs were visualized via immunohistochemistry and were quantitatively detected using real-time polymerase chain reaction (PCR). Signal proteins of phospho-extracellular signal-regulated kinase 1/2 (p-ERK 1/2) were detected by western blot analysis.
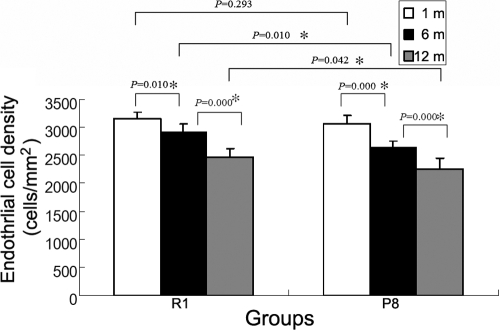
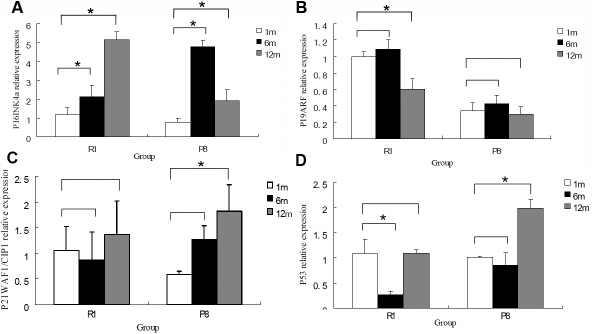
Results: Our results indicated that the ECD values decreased with increasing age in both the SAM-R1 and SAM P8 series where the values in the older SAM p8 series decreased even lower than in the older SAM R1 series. The mean decreased rate was 2.276% per month in the SAM R1 and 2.755% per month in the SAM P8 series. In addition, changes in the senescence-like ultrastructure were observed in the CECs of both strains, and the increase in the positive staining of SA-beta-Gal was observed in both strains as well. It is worth noting that such changes were more significant in the SAM P8 strain. Immunohistochemical detection assays indicated the expression of p-ERK 1/2, p16(INK4a), p19(ARF), p21(WAF1/CIP1), and p53 (nuclear localization for each) in each age group analyzed. Furthermore, the results of real-time PCR studies showed an increase in the expression of p16(INK4a) mRNA as a function of age in the SAM R1 strain and in the early senescence stage of the SAM P8 strain in addition to an increase in the expression of p21(WAF1/CIP1) and p53 mRNA as a function of age in the SAM P8 strain (no significant increase was observed in the SAM R1 strain). Additional results from western blot analysis demonstrated an age-related increase in the quantity of the p-ERK 1/2 proteins in both strains.
Conclusions: The SAM R1 and SAM P8 strains represent suitable models for the study of CEC senescence in vivo. In addition, the progression of cellular senescence in CECs occurs more quickly in the SAM P8 strain as opposed to the SAM R1 strain. Our results also indicate that the p16(INK4a) signaling pathway may play a key role in the early stages of senescence in CECs while the p53/p21(WAF1/CIP1) signaling pathway may exert its principle effect in the late stages of senescence in CECs. Further study is still required about the role of the mitogen-activated protein kinase (MAPK) signaling cascade in the process of senescence in CECs.
Figures
Similar articles
-
Endothelial Cdkn1a (p21) overexpression and accelerated senescence in a mouse model of Fuchs endothelial corneal dystrophy.Invest Ophthalmol Vis Sci. 2012 Sep 28;53(10):6718-27. doi: 10.1167/iovs.12-9669. Invest Ophthalmol Vis Sci. 2012. PMID: 22956607 Free PMC article.
-
Expression of senescence-related genes in human corneal endothelial cells.Mol Vis. 2008 Jan 29;14:161-70. Mol Vis. 2008. PMID: 18334933 Free PMC article.
-
Resistance of primary cultured mouse hepatic tumor cells to cellular senescence despite expression of p16(Ink4a), p19(Arf), p53, and p21(Waf1/Cip1).Mol Carcinog. 2001 Sep;32(1):9-18. doi: 10.1002/mc.1059. Mol Carcinog. 2001. PMID: 11568971
-
Role of hypoxia in cellular senescence.Pharmacol Res. 2023 Aug;194:106841. doi: 10.1016/j.phrs.2023.106841. Epub 2023 Jun 28. Pharmacol Res. 2023. PMID: 37385572 Review.
-
Histone chaperone Jun dimerization protein 2 (JDP2): role in cellular senescence and aging.Kaohsiung J Med Sci. 2010 Oct;26(10):515-31. doi: 10.1016/S1607-551X(10)70081-4. Kaohsiung J Med Sci. 2010. PMID: 20950777 Free PMC article. Review.
Cited by
-
MicroRNA profile comparison of the corneal endothelia of young and old mice: implications for senescence of the corneal endothelium.Mol Vis. 2013 Aug 6;19:1815-25. eCollection 2013. Mol Vis. 2013. PMID: 23946636 Free PMC article.
-
Proliferative capacity of corneal endothelial cells.Exp Eye Res. 2012 Feb;95(1):16-23. doi: 10.1016/j.exer.2011.08.014. Epub 2011 Aug 30. Exp Eye Res. 2012. PMID: 21906590 Free PMC article. Review.
-
Establishment of a continuous untransfected human corneal endothelial cell line and its biocompatibility to denuded amniotic membrane.Mol Vis. 2011 Feb 15;17:469-80. Mol Vis. 2011. PMID: 21365020 Free PMC article.
-
Nodes and biological processes identified on the basis of network analysis in the brain of the senescence accelerated mice as an Alzheimer's disease animal model.Front Aging Neurosci. 2013 Oct 29;5:65. doi: 10.3389/fnagi.2013.00065. eCollection 2013. Front Aging Neurosci. 2013. PMID: 24194717 Free PMC article.
-
Endothelial Cdkn1a (p21) overexpression and accelerated senescence in a mouse model of Fuchs endothelial corneal dystrophy.Invest Ophthalmol Vis Sci. 2012 Sep 28;53(10):6718-27. doi: 10.1167/iovs.12-9669. Invest Ophthalmol Vis Sci. 2012. PMID: 22956607 Free PMC article.
References
-
- Hollingsworth J, Perez-Gomez I, Mutalib HA, Efron N. A population study of the normal cornea using an in vivo slitscanning confocal microscope. Optom Vis Sci. 2001;78:706–11. - PubMed
-
- Ikebe H, Takamatsu T, Itoi M, Fujita S. Cytofluorometric nuclear DNA determinations on human corneal endothelial cells. Exp Eye Res. 1984;39:497–504. - PubMed
-
- Ikebe H, Takamatsu T, Itoi M, Fujita S. Age-dependent changes in nuclear DNA content and cell size of presumably normal human corneal endothelium. Exp Eye Res. 1986;43:251–8. - PubMed
-
- Ikebe H, Takamatsu T, Itoi M, Fujita S. Changes in nuclear DNA content and cell size of injured human corneal endothelium. Exp Eye Res. 1988;47:205–15. - PubMed
-
- Bourne WM, Hodge DO, Nelson LR. Corneal endothelium five years after transplantation. Am J Ophthalmol. 1994;118:185–96. - PubMed
Publication types
MeSH terms
Substances
LinkOut - more resources
Full Text Sources
Research Materials
Miscellaneous