. 2009 Jun;100(6):505-20.
doi: 10.1007/s00422-009-0304-y. Epub 2009 Apr 21.

Role of spike-frequency adaptation in shaping neuronal response to dynamic stimuli

Affiliations

Role of spike-frequency adaptation in shaping neuronal response to dynamic stimuli

Simon Peter Peron et al. Biol Cybern. 2009 Jun.

Abstract

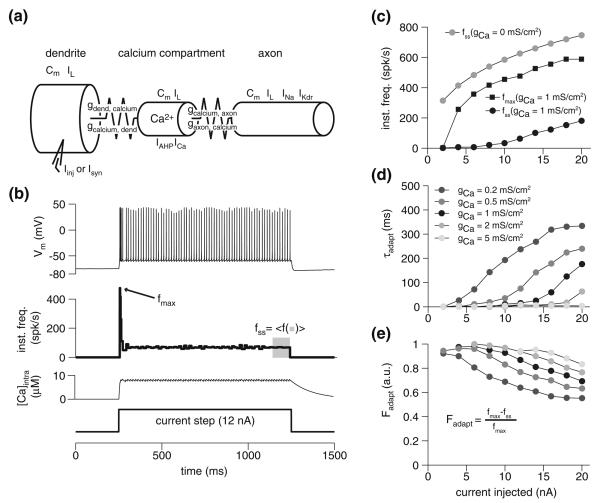
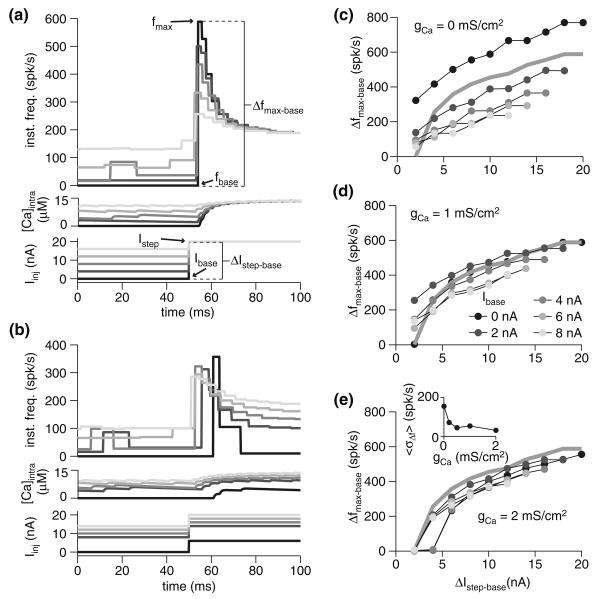
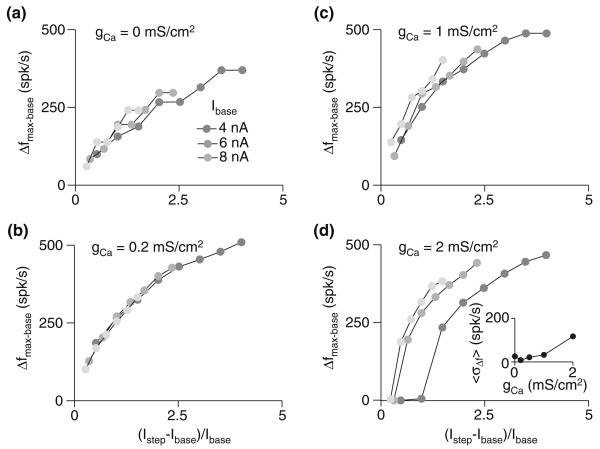
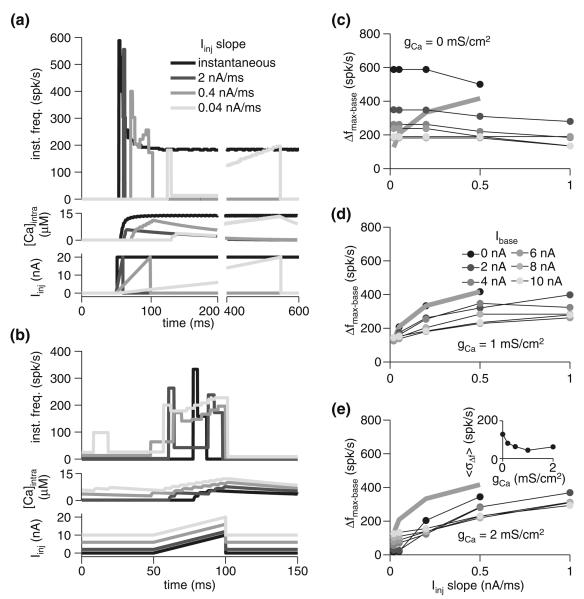
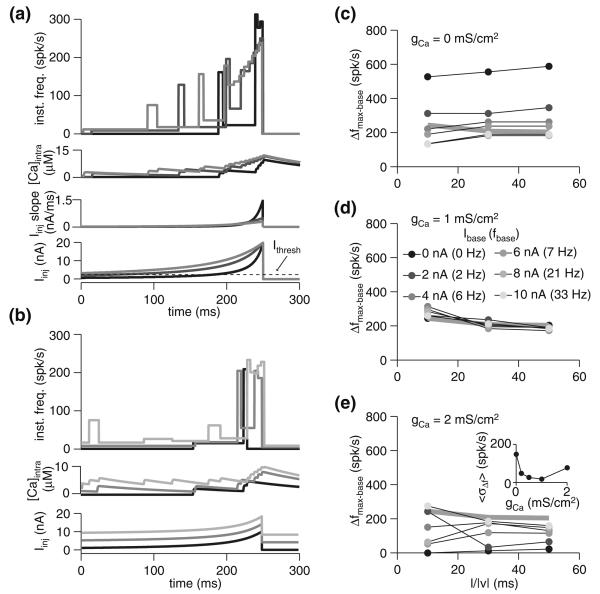
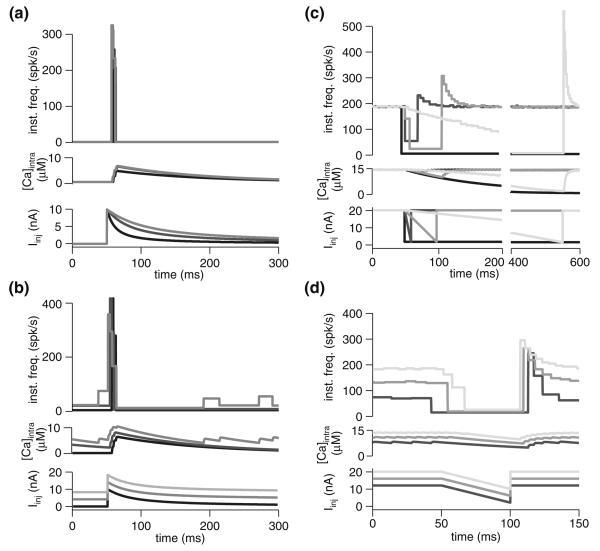
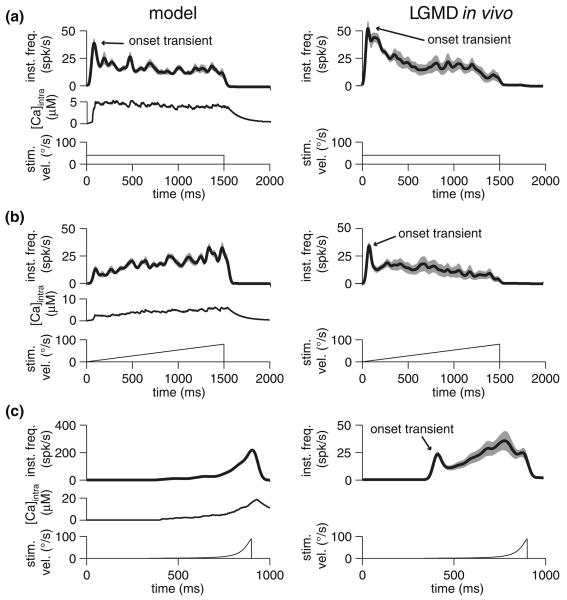
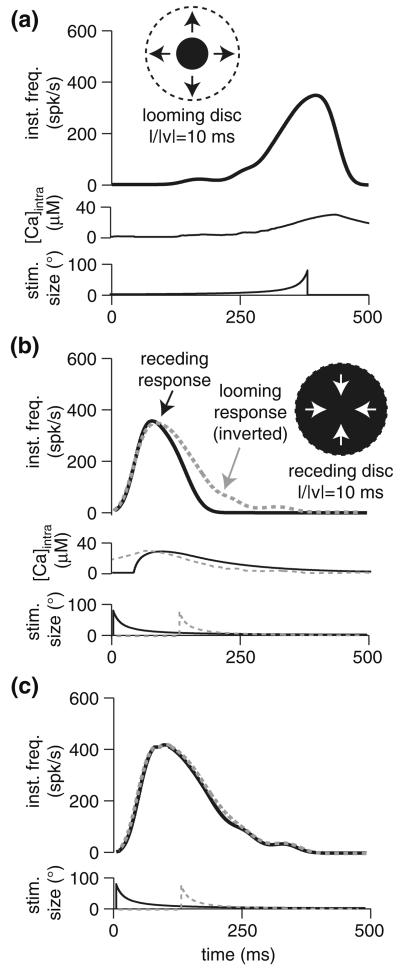
Spike-frequency adaptation is the reduction of a neuron's firing rate to a stimulus of constant intensity. In the locust, the Lobula Giant Movement Detector (LGMD) is a visual interneuron that exhibits rapid adaptation to both current injection and visual stimuli. Here, a reduced compartmental model of the LGMD is employed to explore adaptation's role in selectivity for stimuli whose intensity changes with time. We show that supralinearly increasing current injection stimuli are best at driving a high spike count in the response, while linearly increasing current injection stimuli (i.e., ramps) are best at attaining large firing rate changes in an adapting neuron. This result is extended with in vivo experiments showing that the LGMD's response to translating stimuli having a supralinear velocity profile is larger than the response to constant or linearly increasing velocity translation. Furthermore, we show that the LGMD's preference for approaching versus receding stimuli can partly be accounted for by adaptation. Finally, we show that the LGMD's adaptation mechanism appears well tuned to minimize sensitivity for the level of basal input.


Figures

Fig. 1
Fig. 1
The spike-frequency adaptation model and its basic properties. a Schematic of the three-compartment model employed for simulations. Cm denotes membrane capacitance, Ix (x = L, stim, Ca, Na and Kdr) denotes the presence of a particular current (Sect. 3). The coupling conductance from compartment a to b, is denoted by ga,b and is asymmetric (i.e., ga,bgb,a; see Sect. 3). b Response of the model to a 12 nA depolarizing current injection, with gCa = 1 mS/cm2. From top to bottom, panels show the membrane potential response, instantaneous frequency, intracellular calcium concentration, and current step, respectively. c Peak (fmax) and steady-state (fss) response frequency during current injection. Black circles and squares show response in model with adaptation (gCa = 1 mS/cm2); grey circles show the steady-state for the model without adaptation (gCa = 0mS/cm2). Size of current step indicated on abscissa. d Adaptation time constant for various injection currents and levels of calcium conductance. e Adaptation ratios for the same current injection levels as in d
Fig. 2
Fig. 2
Spike-frequency adaptation as a mechanism for dynamic range modulation. a Instantaneous frequency and calcium response of the model with gCa = 1 mS/cm2 for various baseline currents and steps to 20 nA. Injected current is depicted at bottom. b Instantaneous frequency and calcium response of the model with gCa = 1 mS/cm2 for various baseline currents and steps of 10 nA. c–e Maximal change in firing frequency (Δfmax−base) for various baseline currents (Ibase; gray scale, as indicated in panel d) and current step size (ΔIstep−base). Baseline frequency (fbase) was measured as the mean frequency over the last 100 ms of injection with baseline current. The three panels show the response of the model with varying degrees of spike-frequency adaptation: none (gCa = 0 mS/cm2; c), fit to the underlying physiology (gCa = 1 mS/cm2; d), and above the physiological-fit value (gCa = 2 mS/cm2; e). The gray line denotes the response with Ibase = 0 nA and gCa = 1 mS/cm2. The inset in panel e shows response variability as a function of gCa. For each ΔIstep−base, the standard deviation of the Δfmax−base responses across various Ibase values was obtained, and the mean of these (〈σΔf〉) is given for each gCa
Fig. 3
Fig. 3
Spike-frequency adaptation renders a cell's response to relative input intensity changes largely invariant to baseline input. a–d Maximal change in firing frequency (Δfmax−base) for various baseline currents (Ibase; gray scale, as indicated in panel a) and relative current step sizes ((IstepIbase)/Ibase). The four panels show the response of the model with varying degrees of spike-frequency adaptation: none (gCa = 0 mS/cm2; a), below the physiological-fit value (gCa = 0.2 mS/cm2; b), fit to the underlying physiology (gCa = 1 mS/cm2; c), and above the physiological-fit value (gCa = 2 mS/cm2; d). The inset in panel d shows response variability (〈σΔf〉; see Fig. 2) as a function of gCa; in this case, the mean was computed across (IstepIbase)/Ibase
Fig. 4
Fig. 4
Spike-frequency adaptation reduces responses to stimuli with low derivatives without much effect on high derivative stimuli. a Instantaneous frequency and calcium response of the model with gCa = 1 mS/cm2 for various current ramp slopes. All steps were from 0 to 20 nA. The ramp slope was varied by modulating current injection duration. The black response is to an instantaneous step to 20 nA. Injected current is depicted below. b Instantaneous frequency and calcium response of the model with gCa = 1 mS/cm2 for various baseline currents and steps 50 ms long to 10 nA above baseline (slope of 0.2 nA/ms; Ibase of 0, 2, 6, and 10 nA). c–e Maximal change in firing frequency (Δfmax−base) for various baseline currents (Ibase; gray scale, as indicated in panel d) and current ramp slopes. All steps were 10 nA in amplitude at their maximum. The three panels show the response of the model with varying degrees of spike-frequency adaptation: none (gCa = 0 mS/cm2; c), fit to the underlying physiology (gCa = 1 mS/cm2; d), and above the physiological-fit value (gCa = 2 mS/cm2; e). The gray line denotes the response with Ibase = 0 nA and gCa = 1 mS/cm2. The inset in panel e shows response variability (〈σΔf〉; see Fig. 2) as a function of gCa
Fig. 5
Fig. 5
Spike-frequency adaptation reduces the range of responses to current injections with intensity profiles mimicking visual looming. a Instantaneous frequency and calcium response of the model with gCa = 1 mS/cm2 for current injections mimicking looming stimuli with various l/|ν| values. (Iinj(t) governed by θ(t), Eq. 4). All steps were from 0 to 20 nA (i.e., Ibase = 0). From lightest to darkest, simulated l/|ν| was 50, 30, and 10 ms. The temporal profile of injected current is depicted below, with the dotted line indicating the threshold current (Ithresh; ~3 nA). b Instantaneous frequency response of the model with gCa = 1 mS/cm2 for various baseline currents (0, 4, and 8 nA) and steps to 10 nA above baseline mimicking an l/|ν| value of 30 ms. c–e Maximal change in firing frequency (Δfmax−base) for various baseline currents (Ibase; gray scale as indicated in panel d) and simulated l/|ν|. All steps were 10 nA in amplitude at their maximum. The three panels show the response of the model with varying degrees of spike-frequency adaptation: none (gCa = 0 mS/cm2; c), fit to the underlying physiology (gCa = 1 mS/cm2; d), and above the physiological-fit value (gCa = 2 mS/cm2; e). The gray line denotes the response with Ibase = 0 nA and gCa = 1 mS/cm2. The inset in panel d shows response variability (σΔf; see Fig. 2) as a function of gCa
Fig. 6
Fig. 6
Spike-frequency adaptation results in sharply reduced responses to stimuli of decreasing strength. a Instantaneous frequency and calcium response of the model with gCa = 1 mS/cm2 for current injections mimicking receding stimuli with various l/|ν| values. (Iinj(t) governed by θ(t),Eq. 4). All steps were from 0 to 10 nA. From lightest to darkest, simulated l/|ν| was 50, 30, and 10 ms. The temporal profile of injected current is depicted below. b Instantaneous frequency and calcium response of the model with gCa = 1 mS/cm2 for various baseline currents (0, 4, and 8 nA) and steps to 10 nA above baseline mimicking an l/|ν| value of 30 ms. c Instantaneous frequency and calcium response of the model with gCa = 1 mS/cm2 for various negative current ramp slopes. All steps were from 20 to 0 nA (i.e., Ibase = 20). d Instantaneous frequency and calcium response of the model with gCa = 1 mS/cm2 for various baseline currents and steps taking 50 ms to 10 nA below baseline (slope of −0.2 nA/ms)
Fig. 7
Fig. 7
Instantaneous frequency and calcium response in model (left), and instantaneous frequency response in the LGMD in vivo (right) to translating squares having various velocity profiles (indicated at the bottom of each panel). All responses are Gaussian-convolved (σ = 20 ms) mean instantaneous frequency responses, with SEM shown in grey. Model data was obtained by simulating ten presentations; in vivo data was obtained by taking the mean of the averaged responses for each animal (n = 6 animals). All stimuli consisted of 10° by 10° squares moving across 60° of real or simulated visual space, at fixed azimuth (90°) starting and ending at elevations of 30° and −30°, respectively (0° azimuth corresponds to the animal's front, and 0° elevation is the equator of the eye; see Krapp and Gabbiani 2005 for detailed description of coordinate system). a Response to stimulus having fixed velocity of 40°/s. b Response to stimulus with starting velocity of 0°/s and ending with velocity of 80°/s. c Response to square with a loom-like velocity profile, with velocity governed by ψ(t) (Eq. 5) for a looming object's edge where l/|ν| = 50 ms
Fig. 8
Fig. 8
Role of spike-frequency adaptation in selectivity for approaching versus receding stimuli. a Response of model with full spike-frequency adaptation (τCa = 130 ms) to approach by a looming stimulus with l/|ν| = 10 ms. b Response of model with full spike-frequency adaptation to receding stimulus with l/|ν| 10 ms; the response from a is superimposed with grey dotted line after inverting the time axis and aligning the peaks. c Response of model with reduced spike-frequency adaptation (τCa = 20 ms) to approaching (dotted grey line) and receding (black) stimulus with l/|ν| = 10 ms

Similar articles

Cited by

References

    1. Benda J, Hennig RM. Spike-frequency adaptation generates intensity invariance in a primary auditory interneuron. J Comput Neurosci. 2008;24:113–136. - PubMed
    1. Benda J, Herz AV. A universal model for spike-frequency adaptation. Neural Comput. 2003;15:2523–2564. - PubMed
    1. Benda J, Longtin A, Maler L. Spike-frequency adaptation separates transient communication signals from background oscillations. J Neurosci. 2005;25:2312–2321. - PMC - PubMed
    1. Bhattacharjee A, Kaczmarek LK. For K+ channels, Na+ is the new Ca2+ Trends Neurosci. 2005;28:422–428. - PubMed
    1. Bond CT, Maylie J, Adelman JP. SK channels in excitability, pacemaking and synaptic integration. Curr Opin Neurobiol. 2005;15:305–311. - PubMed